Immigrants from Nepal vs Immigrants from Guatemala College, 1 year or more
COMPARE
Immigrants from Nepal
Immigrants from Guatemala
College, 1 year or more
College, 1 year or more Comparison
Immigrants from Nepal
Immigrants from Guatemala
62.0%
COLLEGE, 1 YEAR OR MORE
96.3/ 100
METRIC RATING
105th/ 347
METRIC RANK
50.7%
COLLEGE, 1 YEAR OR MORE
0.0/ 100
METRIC RATING
323rd/ 347
METRIC RANK
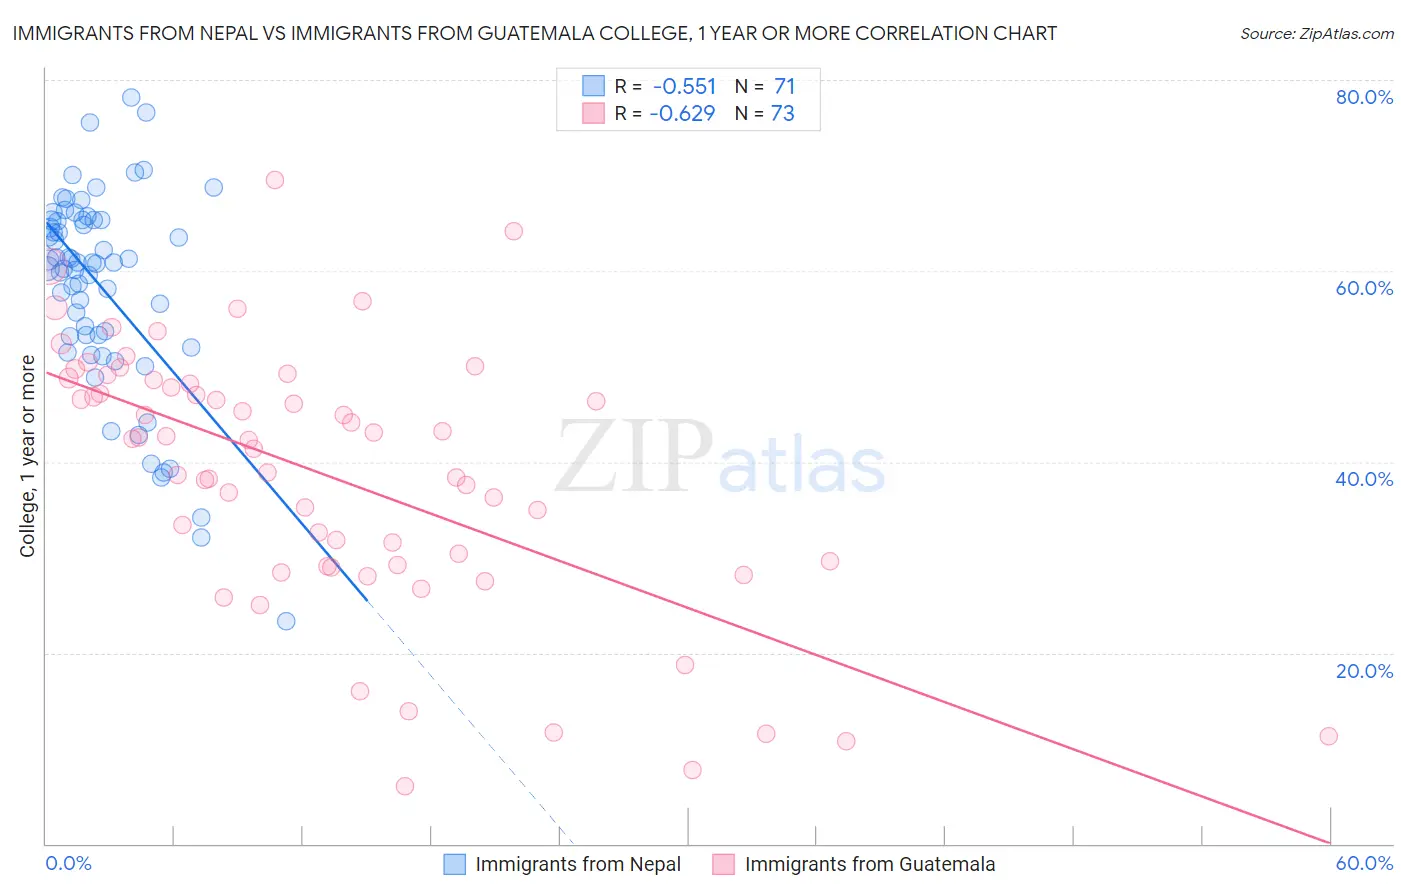
Immigrants from Nepal vs Immigrants from Guatemala College, 1 year or more Correlation Chart
The statistical analysis conducted on geographies consisting of 186,770,697 people shows a substantial negative correlation between the proportion of Immigrants from Nepal and percentage of population with at least college, 1 year or more education in the United States with a correlation coefficient (R) of -0.551 and weighted average of 62.0%. Similarly, the statistical analysis conducted on geographies consisting of 377,285,447 people shows a significant negative correlation between the proportion of Immigrants from Guatemala and percentage of population with at least college, 1 year or more education in the United States with a correlation coefficient (R) of -0.629 and weighted average of 50.7%, a difference of 22.3%.
College, 1 year or more Correlation Summary
| Measurement | Immigrants from Nepal | Immigrants from Guatemala |
| Minimum | 23.3% | 6.0% |
| Maximum | 78.1% | 69.5% |
| Range | 54.8% | 63.5% |
| Mean | 58.2% | 38.6% |
| Median | 60.8% | 42.3% |
| Interquartile 25% (IQ1) | 53.2% | 29.2% |
| Interquartile 75% (IQ3) | 65.3% | 48.4% |
| Interquartile Range (IQR) | 12.1% | 19.2% |
| Standard Deviation (Sample) | 10.6% | 13.8% |
| Standard Deviation (Population) | 10.6% | 13.7% |
Similar Demographics by College, 1 year or more
Demographics Similar to Immigrants from Nepal by College, 1 year or more
In terms of college, 1 year or more, the demographic groups most similar to Immigrants from Nepal are Palestinian (62.0%, a difference of 0.0%), Chilean (62.0%, a difference of 0.020%), Afghan (62.0%, a difference of 0.030%), Luxembourger (62.1%, a difference of 0.15%), and Swedish (62.1%, a difference of 0.16%).
| Demographics | Rating | Rank | College, 1 year or more |
| Carpatho Rusyns | 97.2 /100 | #98 | Exceptional 62.2% |
| Croatians | 97.1 /100 | #99 | Exceptional 62.2% |
| Icelanders | 96.8 /100 | #100 | Exceptional 62.1% |
| Swedes | 96.8 /100 | #101 | Exceptional 62.1% |
| Luxembourgers | 96.7 /100 | #102 | Exceptional 62.1% |
| Afghans | 96.4 /100 | #103 | Exceptional 62.0% |
| Chileans | 96.4 /100 | #104 | Exceptional 62.0% |
| Immigrants | Nepal | 96.3 /100 | #105 | Exceptional 62.0% |
| Palestinians | 96.3 /100 | #106 | Exceptional 62.0% |
| Immigrants | Ukraine | 95.8 /100 | #107 | Exceptional 61.9% |
| Syrians | 95.7 /100 | #108 | Exceptional 61.9% |
| Immigrants | Northern Africa | 95.7 /100 | #109 | Exceptional 61.9% |
| Europeans | 95.6 /100 | #110 | Exceptional 61.8% |
| Macedonians | 95.6 /100 | #111 | Exceptional 61.8% |
| Austrians | 95.4 /100 | #112 | Exceptional 61.8% |
Demographics Similar to Immigrants from Guatemala by College, 1 year or more
In terms of college, 1 year or more, the demographic groups most similar to Immigrants from Guatemala are Immigrants from Cuba (50.7%, a difference of 0.010%), Immigrants from Latin America (50.7%, a difference of 0.040%), Dominican (50.6%, a difference of 0.22%), Navajo (50.8%, a difference of 0.23%), and Menominee (50.6%, a difference of 0.26%).
| Demographics | Rating | Rank | College, 1 year or more |
| Cajuns | 0.0 /100 | #316 | Tragic 51.2% |
| Hispanics or Latinos | 0.0 /100 | #317 | Tragic 51.1% |
| Immigrants | Honduras | 0.0 /100 | #318 | Tragic 51.0% |
| Immigrants | El Salvador | 0.0 /100 | #319 | Tragic 51.0% |
| Kiowa | 0.0 /100 | #320 | Tragic 51.0% |
| Hopi | 0.0 /100 | #321 | Tragic 50.9% |
| Navajo | 0.0 /100 | #322 | Tragic 50.8% |
| Immigrants | Guatemala | 0.0 /100 | #323 | Tragic 50.7% |
| Immigrants | Cuba | 0.0 /100 | #324 | Tragic 50.7% |
| Immigrants | Latin America | 0.0 /100 | #325 | Tragic 50.7% |
| Dominicans | 0.0 /100 | #326 | Tragic 50.6% |
| Menominee | 0.0 /100 | #327 | Tragic 50.6% |
| Dutch West Indians | 0.0 /100 | #328 | Tragic 50.5% |
| Cape Verdeans | 0.0 /100 | #329 | Tragic 50.3% |
| Natives/Alaskans | 0.0 /100 | #330 | Tragic 50.2% |