Immigrants from Nepal vs Puget Sound Salish College, 1 year or more
COMPARE
Immigrants from Nepal
Puget Sound Salish
College, 1 year or more
College, 1 year or more Comparison
Immigrants from Nepal
Puget Sound Salish
62.0%
COLLEGE, 1 YEAR OR MORE
96.3/ 100
METRIC RATING
105th/ 347
METRIC RANK
55.9%
COLLEGE, 1 YEAR OR MORE
1.1/ 100
METRIC RATING
239th/ 347
METRIC RANK
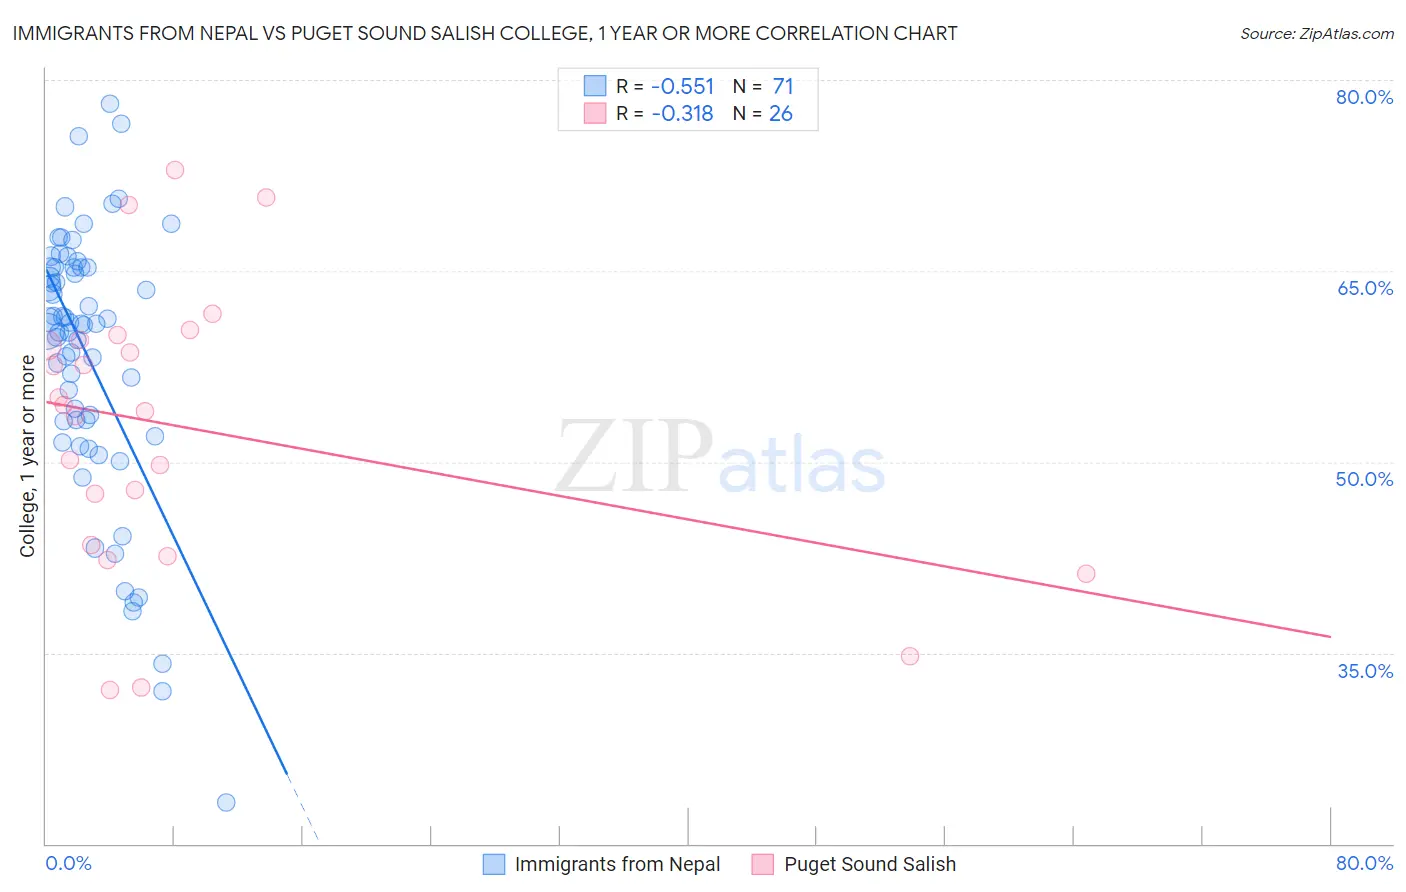
Immigrants from Nepal vs Puget Sound Salish College, 1 year or more Correlation Chart
The statistical analysis conducted on geographies consisting of 186,770,697 people shows a substantial negative correlation between the proportion of Immigrants from Nepal and percentage of population with at least college, 1 year or more education in the United States with a correlation coefficient (R) of -0.551 and weighted average of 62.0%. Similarly, the statistical analysis conducted on geographies consisting of 46,155,865 people shows a mild negative correlation between the proportion of Puget Sound Salish and percentage of population with at least college, 1 year or more education in the United States with a correlation coefficient (R) of -0.318 and weighted average of 55.9%, a difference of 10.9%.
College, 1 year or more Correlation Summary
| Measurement | Immigrants from Nepal | Puget Sound Salish |
| Minimum | 23.3% | 32.1% |
| Maximum | 78.1% | 72.9% |
| Range | 54.8% | 40.8% |
| Mean | 58.2% | 52.7% |
| Median | 60.8% | 54.3% |
| Interquartile 25% (IQ1) | 53.2% | 43.4% |
| Interquartile 75% (IQ3) | 65.3% | 59.6% |
| Interquartile Range (IQR) | 12.1% | 16.2% |
| Standard Deviation (Sample) | 10.6% | 11.1% |
| Standard Deviation (Population) | 10.6% | 10.9% |
Similar Demographics by College, 1 year or more
Demographics Similar to Immigrants from Nepal by College, 1 year or more
In terms of college, 1 year or more, the demographic groups most similar to Immigrants from Nepal are Palestinian (62.0%, a difference of 0.0%), Chilean (62.0%, a difference of 0.020%), Afghan (62.0%, a difference of 0.030%), Luxembourger (62.1%, a difference of 0.15%), and Swedish (62.1%, a difference of 0.16%).
| Demographics | Rating | Rank | College, 1 year or more |
| Carpatho Rusyns | 97.2 /100 | #98 | Exceptional 62.2% |
| Croatians | 97.1 /100 | #99 | Exceptional 62.2% |
| Icelanders | 96.8 /100 | #100 | Exceptional 62.1% |
| Swedes | 96.8 /100 | #101 | Exceptional 62.1% |
| Luxembourgers | 96.7 /100 | #102 | Exceptional 62.1% |
| Afghans | 96.4 /100 | #103 | Exceptional 62.0% |
| Chileans | 96.4 /100 | #104 | Exceptional 62.0% |
| Immigrants | Nepal | 96.3 /100 | #105 | Exceptional 62.0% |
| Palestinians | 96.3 /100 | #106 | Exceptional 62.0% |
| Immigrants | Ukraine | 95.8 /100 | #107 | Exceptional 61.9% |
| Syrians | 95.7 /100 | #108 | Exceptional 61.9% |
| Immigrants | Northern Africa | 95.7 /100 | #109 | Exceptional 61.9% |
| Europeans | 95.6 /100 | #110 | Exceptional 61.8% |
| Macedonians | 95.6 /100 | #111 | Exceptional 61.8% |
| Austrians | 95.4 /100 | #112 | Exceptional 61.8% |
Demographics Similar to Puget Sound Salish by College, 1 year or more
In terms of college, 1 year or more, the demographic groups most similar to Puget Sound Salish are Trinidadian and Tobagonian (55.8%, a difference of 0.090%), French American Indian (55.8%, a difference of 0.14%), Barbadian (56.0%, a difference of 0.20%), Marshallese (55.8%, a difference of 0.25%), and Osage (55.8%, a difference of 0.26%).
| Demographics | Rating | Rank | College, 1 year or more |
| Immigrants | Bangladesh | 2.6 /100 | #232 | Tragic 56.6% |
| Immigrants | Nonimmigrants | 2.5 /100 | #233 | Tragic 56.5% |
| Spanish Americans | 1.8 /100 | #234 | Tragic 56.3% |
| West Indians | 1.8 /100 | #235 | Tragic 56.3% |
| Iroquois | 1.7 /100 | #236 | Tragic 56.2% |
| Samoans | 1.6 /100 | #237 | Tragic 56.2% |
| Barbadians | 1.3 /100 | #238 | Tragic 56.0% |
| Puget Sound Salish | 1.1 /100 | #239 | Tragic 55.9% |
| Trinidadians and Tobagonians | 1.1 /100 | #240 | Tragic 55.8% |
| French American Indians | 1.0 /100 | #241 | Tragic 55.8% |
| Marshallese | 1.0 /100 | #242 | Tragic 55.8% |
| Osage | 1.0 /100 | #243 | Tragic 55.8% |
| Chippewa | 0.9 /100 | #244 | Tragic 55.7% |
| Immigrants | Liberia | 0.8 /100 | #245 | Tragic 55.7% |
| Malaysians | 0.8 /100 | #246 | Tragic 55.6% |