Immigrants from Middle Africa vs Finnish GED/Equivalency
COMPARE
Immigrants from Middle Africa
Finnish
GED/Equivalency
GED/Equivalency Comparison
Immigrants from Middle Africa
Finns
84.4%
GED/EQUIVALENCY
4.3/ 100
METRIC RATING
231st/ 347
METRIC RANK
88.2%
GED/EQUIVALENCY
99.6/ 100
METRIC RATING
41st/ 347
METRIC RANK
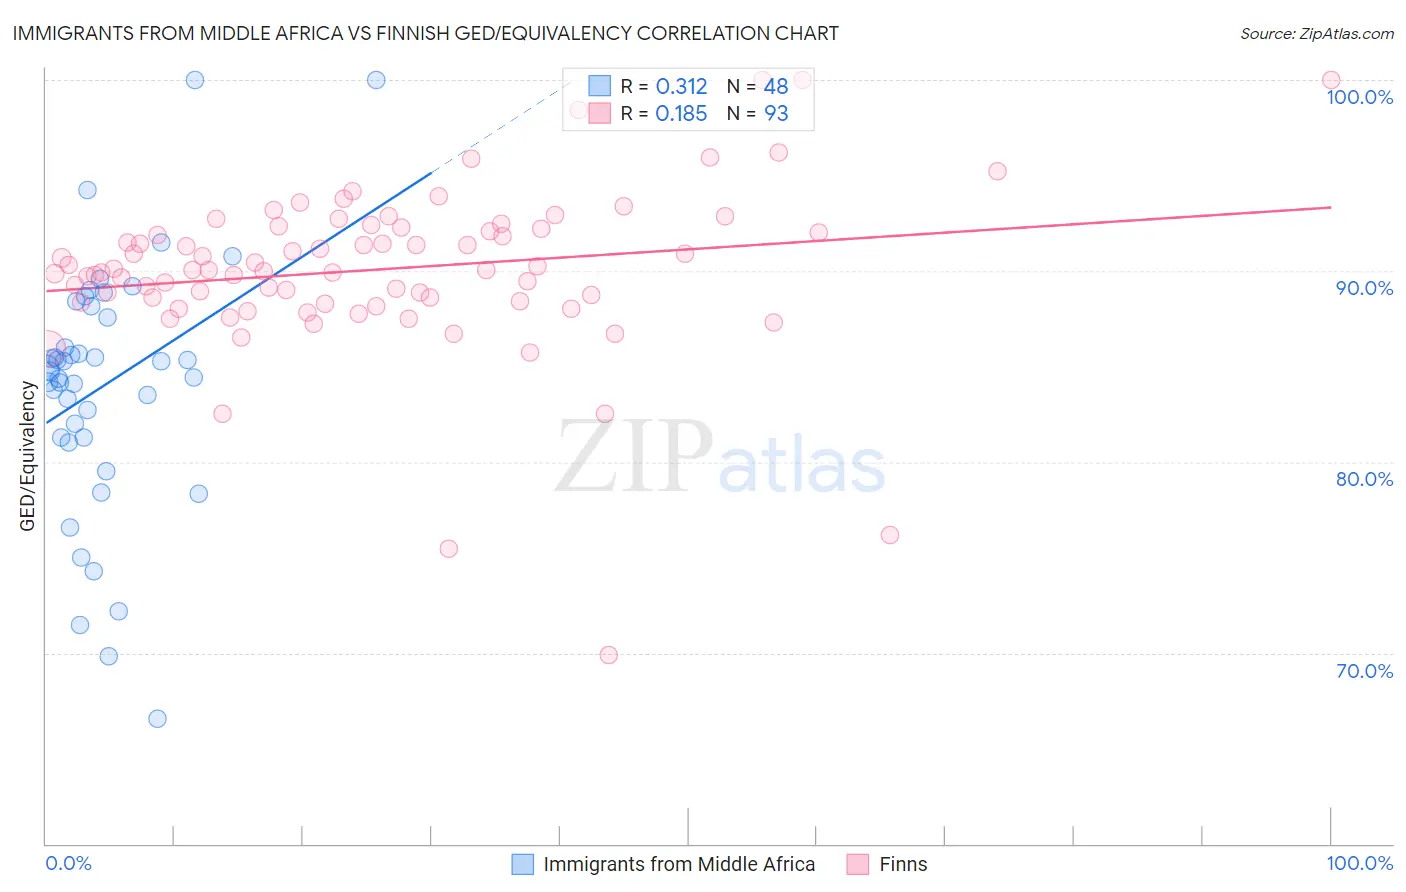
Immigrants from Middle Africa vs Finnish GED/Equivalency Correlation Chart
The statistical analysis conducted on geographies consisting of 202,748,536 people shows a mild positive correlation between the proportion of Immigrants from Middle Africa and percentage of population with at least ged/equivalency education in the United States with a correlation coefficient (R) of 0.312 and weighted average of 84.4%. Similarly, the statistical analysis conducted on geographies consisting of 404,676,025 people shows a poor positive correlation between the proportion of Finns and percentage of population with at least ged/equivalency education in the United States with a correlation coefficient (R) of 0.185 and weighted average of 88.2%, a difference of 4.5%.
GED/Equivalency Correlation Summary
| Measurement | Immigrants from Middle Africa | Finnish |
| Minimum | 66.6% | 69.9% |
| Maximum | 100.0% | 100.0% |
| Range | 33.4% | 30.1% |
| Mean | 84.0% | 90.1% |
| Median | 84.8% | 90.1% |
| Interquartile 25% (IQ1) | 81.3% | 88.4% |
| Interquartile 75% (IQ3) | 87.9% | 92.3% |
| Interquartile Range (IQR) | 6.6% | 3.9% |
| Standard Deviation (Sample) | 6.6% | 4.4% |
| Standard Deviation (Population) | 6.6% | 4.3% |
Similar Demographics by GED/Equivalency
Demographics Similar to Immigrants from Middle Africa by GED/Equivalency
In terms of ged/equivalency, the demographic groups most similar to Immigrants from Middle Africa are Immigrants from South America (84.4%, a difference of 0.020%), Immigrants from Uruguay (84.4%, a difference of 0.030%), Immigrants from Colombia (84.4%, a difference of 0.030%), Immigrants from Panama (84.4%, a difference of 0.030%), and Immigrants from Liberia (84.4%, a difference of 0.070%).
| Demographics | Rating | Rank | GED/Equivalency |
| French American Indians | 6.3 /100 | #224 | Tragic 84.6% |
| Immigrants | Thailand | 5.8 /100 | #225 | Tragic 84.5% |
| Immigrants | Zaire | 5.5 /100 | #226 | Tragic 84.5% |
| Immigrants | Costa Rica | 5.4 /100 | #227 | Tragic 84.5% |
| Immigrants | Liberia | 4.9 /100 | #228 | Tragic 84.4% |
| Immigrants | Uruguay | 4.6 /100 | #229 | Tragic 84.4% |
| Immigrants | Colombia | 4.5 /100 | #230 | Tragic 84.4% |
| Immigrants | Middle Africa | 4.3 /100 | #231 | Tragic 84.4% |
| Immigrants | South America | 4.2 /100 | #232 | Tragic 84.4% |
| Immigrants | Panama | 4.1 /100 | #233 | Tragic 84.4% |
| Immigrants | Nigeria | 3.6 /100 | #234 | Tragic 84.3% |
| Ghanaians | 3.5 /100 | #235 | Tragic 84.3% |
| Immigrants | Eritrea | 3.5 /100 | #236 | Tragic 84.3% |
| Sub-Saharan Africans | 3.0 /100 | #237 | Tragic 84.2% |
| Immigrants | Peru | 2.7 /100 | #238 | Tragic 84.2% |
Demographics Similar to Finns by GED/Equivalency
In terms of ged/equivalency, the demographic groups most similar to Finns are Italian (88.2%, a difference of 0.010%), Immigrants from Israel (88.2%, a difference of 0.030%), Cambodian (88.2%, a difference of 0.030%), Immigrants from Scotland (88.2%, a difference of 0.030%), and Macedonian (88.1%, a difference of 0.060%).
| Demographics | Rating | Rank | GED/Equivalency |
| Immigrants | Japan | 99.7 /100 | #34 | Exceptional 88.4% |
| Immigrants | South Central Asia | 99.7 /100 | #35 | Exceptional 88.4% |
| Immigrants | Belgium | 99.7 /100 | #36 | Exceptional 88.3% |
| Immigrants | Austria | 99.7 /100 | #37 | Exceptional 88.3% |
| Burmese | 99.7 /100 | #38 | Exceptional 88.3% |
| Immigrants | Israel | 99.6 /100 | #39 | Exceptional 88.2% |
| Italians | 99.6 /100 | #40 | Exceptional 88.2% |
| Finns | 99.6 /100 | #41 | Exceptional 88.2% |
| Cambodians | 99.6 /100 | #42 | Exceptional 88.2% |
| Immigrants | Scotland | 99.6 /100 | #43 | Exceptional 88.2% |
| Macedonians | 99.5 /100 | #44 | Exceptional 88.1% |
| Czechs | 99.5 /100 | #45 | Exceptional 88.1% |
| Immigrants | Switzerland | 99.5 /100 | #46 | Exceptional 88.1% |
| Immigrants | Latvia | 99.5 /100 | #47 | Exceptional 88.1% |
| Greeks | 99.5 /100 | #48 | Exceptional 88.1% |