Immigrants from Middle Africa vs Finnish Unemployment Among Ages 30 to 34 years
COMPARE
Immigrants from Middle Africa
Finnish
Unemployment Among Ages 30 to 34 years
Unemployment Among Ages 30 to 34 years Comparison
Immigrants from Middle Africa
Finns
5.3%
UNEMPLOYMENT AMONG AGES 30 TO 34 YEARS
87.1/ 100
METRIC RATING
108th/ 347
METRIC RANK
5.5%
UNEMPLOYMENT AMONG AGES 30 TO 34 YEARS
30.7/ 100
METRIC RATING
195th/ 347
METRIC RANK
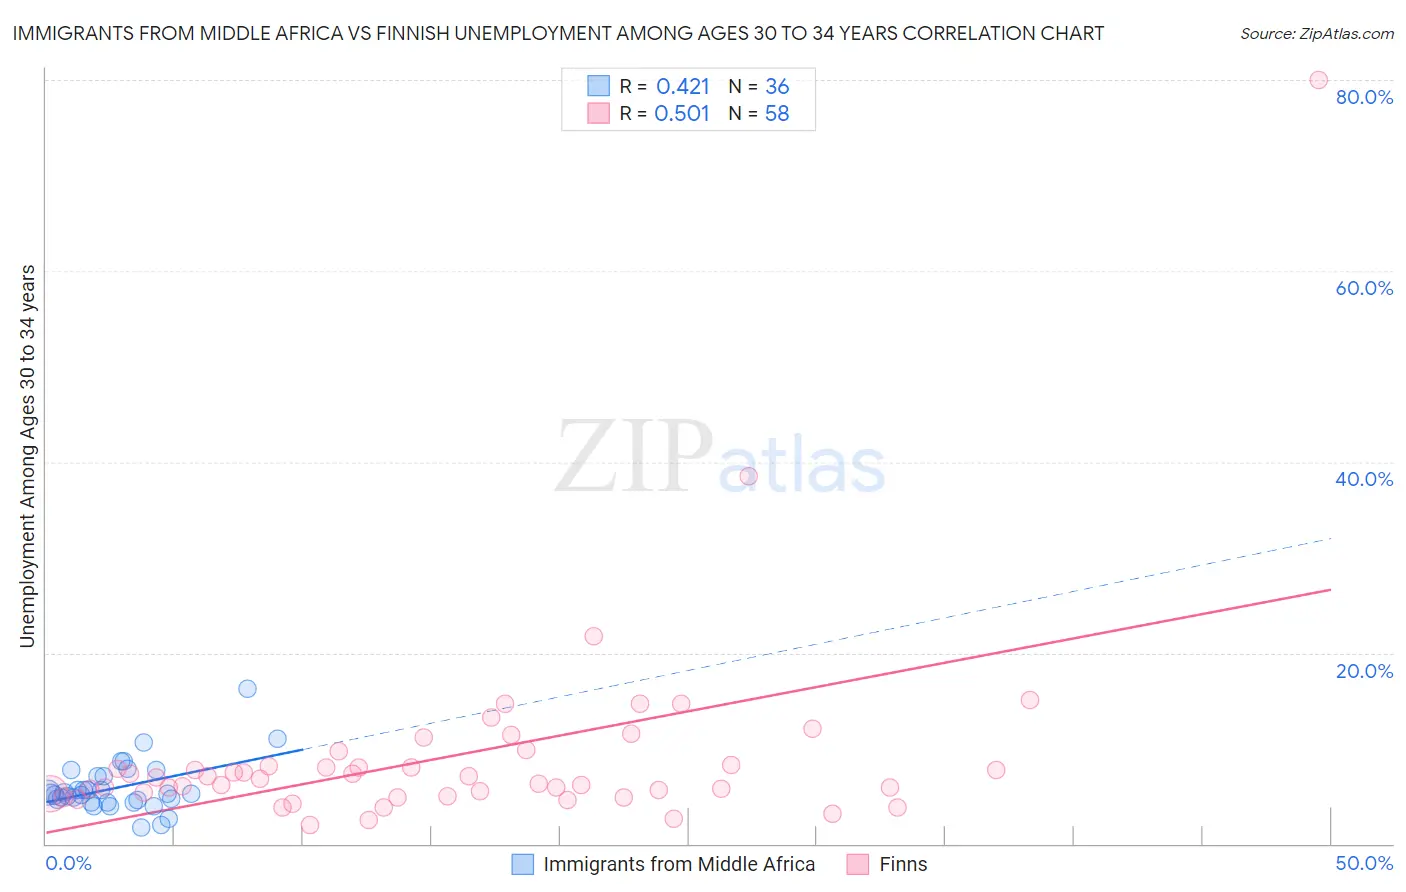
Immigrants from Middle Africa vs Finnish Unemployment Among Ages 30 to 34 years Correlation Chart
The statistical analysis conducted on geographies consisting of 198,095,532 people shows a moderate positive correlation between the proportion of Immigrants from Middle Africa and unemployment rate among population between the ages 30 and 34 in the United States with a correlation coefficient (R) of 0.421 and weighted average of 5.3%. Similarly, the statistical analysis conducted on geographies consisting of 373,300,326 people shows a substantial positive correlation between the proportion of Finns and unemployment rate among population between the ages 30 and 34 in the United States with a correlation coefficient (R) of 0.501 and weighted average of 5.5%, a difference of 4.9%.
Unemployment Among Ages 30 to 34 years Correlation Summary
| Measurement | Immigrants from Middle Africa | Finnish |
| Minimum | 1.7% | 1.9% |
| Maximum | 16.3% | 80.0% |
| Range | 14.6% | 78.1% |
| Mean | 5.9% | 9.2% |
| Median | 5.2% | 6.9% |
| Interquartile 25% (IQ1) | 4.4% | 5.3% |
| Interquartile 75% (IQ3) | 7.0% | 8.2% |
| Interquartile Range (IQR) | 2.6% | 2.9% |
| Standard Deviation (Sample) | 2.7% | 10.9% |
| Standard Deviation (Population) | 2.7% | 10.8% |
Similar Demographics by Unemployment Among Ages 30 to 34 years
Demographics Similar to Immigrants from Middle Africa by Unemployment Among Ages 30 to 34 years
In terms of unemployment among ages 30 to 34 years, the demographic groups most similar to Immigrants from Middle Africa are Icelander (5.3%, a difference of 0.010%), Immigrants from Chile (5.3%, a difference of 0.060%), Croatian (5.3%, a difference of 0.080%), Northern European (5.3%, a difference of 0.12%), and Argentinean (5.3%, a difference of 0.12%).
| Demographics | Rating | Rank | Unemployment Among Ages 30 to 34 years |
| British | 89.1 /100 | #101 | Excellent 5.3% |
| Immigrants | Switzerland | 88.8 /100 | #102 | Excellent 5.3% |
| Immigrants | Jordan | 88.8 /100 | #103 | Excellent 5.3% |
| Northern Europeans | 87.9 /100 | #104 | Excellent 5.3% |
| Argentineans | 87.9 /100 | #105 | Excellent 5.3% |
| Croatians | 87.6 /100 | #106 | Excellent 5.3% |
| Icelanders | 87.2 /100 | #107 | Excellent 5.3% |
| Immigrants | Middle Africa | 87.1 /100 | #108 | Excellent 5.3% |
| Immigrants | Chile | 86.7 /100 | #109 | Excellent 5.3% |
| Egyptians | 86.4 /100 | #110 | Excellent 5.3% |
| Immigrants | Pakistan | 86.2 /100 | #111 | Excellent 5.3% |
| Swiss | 85.9 /100 | #112 | Excellent 5.3% |
| Immigrants | Spain | 85.6 /100 | #113 | Excellent 5.3% |
| Estonians | 83.7 /100 | #114 | Excellent 5.3% |
| Immigrants | Albania | 83.4 /100 | #115 | Excellent 5.3% |
Demographics Similar to Finns by Unemployment Among Ages 30 to 34 years
In terms of unemployment among ages 30 to 34 years, the demographic groups most similar to Finns are Slavic (5.5%, a difference of 0.010%), Immigrants from Africa (5.5%, a difference of 0.030%), Moroccan (5.5%, a difference of 0.040%), Irish (5.5%, a difference of 0.050%), and Immigrants from South America (5.5%, a difference of 0.070%).
| Demographics | Rating | Rank | Unemployment Among Ages 30 to 34 years |
| Immigrants | Norway | 36.1 /100 | #188 | Fair 5.5% |
| Immigrants | England | 35.7 /100 | #189 | Fair 5.5% |
| Immigrants | Kazakhstan | 33.9 /100 | #190 | Fair 5.5% |
| Irish | 31.3 /100 | #191 | Fair 5.5% |
| Moroccans | 31.2 /100 | #192 | Fair 5.5% |
| Immigrants | Africa | 31.0 /100 | #193 | Fair 5.5% |
| Slavs | 30.9 /100 | #194 | Fair 5.5% |
| Finns | 30.7 /100 | #195 | Fair 5.5% |
| Immigrants | South America | 29.8 /100 | #196 | Fair 5.5% |
| Immigrants | Nicaragua | 28.9 /100 | #197 | Fair 5.5% |
| Immigrants | Afghanistan | 27.2 /100 | #198 | Fair 5.6% |
| Nicaraguans | 26.6 /100 | #199 | Fair 5.6% |
| Immigrants | Southern Europe | 25.8 /100 | #200 | Fair 5.6% |
| South American Indians | 24.4 /100 | #201 | Fair 5.6% |
| Immigrants | Germany | 22.9 /100 | #202 | Fair 5.6% |