Immigrants from Middle Africa vs Immigrants from Japan Master's Degree
COMPARE
Immigrants from Middle Africa
Immigrants from Japan
Master's Degree
Master's Degree Comparison
Immigrants from Middle Africa
Immigrants from Japan
14.6%
MASTER'S DEGREE
33.6/ 100
METRIC RATING
192nd/ 347
METRIC RANK
20.0%
MASTER'S DEGREE
100.0/ 100
METRIC RATING
25th/ 347
METRIC RANK
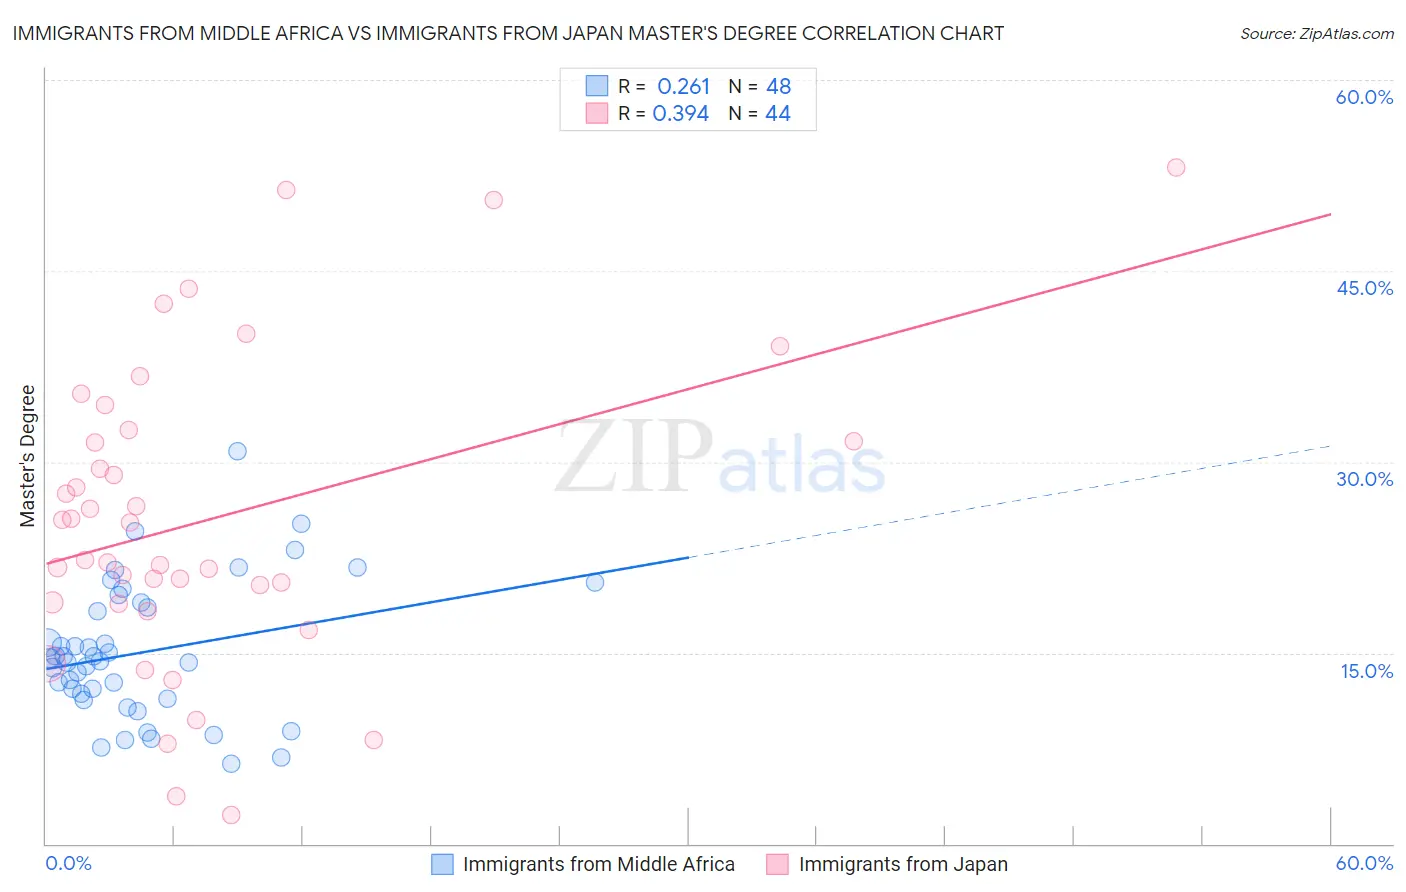
Immigrants from Middle Africa vs Immigrants from Japan Master's Degree Correlation Chart
The statistical analysis conducted on geographies consisting of 202,718,309 people shows a weak positive correlation between the proportion of Immigrants from Middle Africa and percentage of population with at least master's degree education in the United States with a correlation coefficient (R) of 0.261 and weighted average of 14.6%. Similarly, the statistical analysis conducted on geographies consisting of 340,075,167 people shows a mild positive correlation between the proportion of Immigrants from Japan and percentage of population with at least master's degree education in the United States with a correlation coefficient (R) of 0.394 and weighted average of 20.0%, a difference of 37.1%.
Master's Degree Correlation Summary
| Measurement | Immigrants from Middle Africa | Immigrants from Japan |
| Minimum | 6.3% | 2.2% |
| Maximum | 30.8% | 53.1% |
| Range | 24.5% | 50.9% |
| Mean | 15.0% | 25.5% |
| Median | 14.5% | 23.8% |
| Interquartile 25% (IQ1) | 11.6% | 18.9% |
| Interquartile 75% (IQ3) | 18.7% | 32.1% |
| Interquartile Range (IQR) | 7.1% | 13.2% |
| Standard Deviation (Sample) | 5.3% | 12.0% |
| Standard Deviation (Population) | 5.2% | 11.9% |
Similar Demographics by Master's Degree
Demographics Similar to Immigrants from Middle Africa by Master's Degree
In terms of master's degree, the demographic groups most similar to Immigrants from Middle Africa are Welsh (14.6%, a difference of 0.090%), Immigrants from Nigeria (14.6%, a difference of 0.13%), Chinese (14.6%, a difference of 0.17%), Spaniard (14.6%, a difference of 0.31%), and Immigrants (14.6%, a difference of 0.34%).
| Demographics | Rating | Rank | Master's Degree |
| Barbadians | 38.3 /100 | #185 | Fair 14.7% |
| Immigrants | Oceania | 37.1 /100 | #186 | Fair 14.7% |
| Basques | 36.5 /100 | #187 | Fair 14.7% |
| Immigrants | Costa Rica | 36.2 /100 | #188 | Fair 14.7% |
| Immigrants | Immigrants | 36.0 /100 | #189 | Fair 14.6% |
| Spaniards | 35.8 /100 | #190 | Fair 14.6% |
| Welsh | 34.2 /100 | #191 | Fair 14.6% |
| Immigrants | Middle Africa | 33.6 /100 | #192 | Fair 14.6% |
| Immigrants | Nigeria | 32.7 /100 | #193 | Fair 14.6% |
| Chinese | 32.5 /100 | #194 | Fair 14.6% |
| Danes | 31.3 /100 | #195 | Fair 14.5% |
| Czechoslovakians | 29.9 /100 | #196 | Fair 14.5% |
| Belgians | 28.0 /100 | #197 | Fair 14.5% |
| West Indians | 27.4 /100 | #198 | Fair 14.5% |
| Immigrants | Armenia | 27.2 /100 | #199 | Fair 14.5% |
Demographics Similar to Immigrants from Japan by Master's Degree
In terms of master's degree, the demographic groups most similar to Immigrants from Japan are Cambodian (20.0%, a difference of 0.10%), Immigrants from Sri Lanka (19.9%, a difference of 0.51%), Turkish (19.9%, a difference of 0.58%), Latvian (19.8%, a difference of 0.99%), and Immigrants from Sweden (20.3%, a difference of 1.3%).
| Demographics | Rating | Rank | Master's Degree |
| Soviet Union | 100.0 /100 | #18 | Exceptional 20.5% |
| Immigrants | Hong Kong | 100.0 /100 | #19 | Exceptional 20.5% |
| Indians (Asian) | 100.0 /100 | #20 | Exceptional 20.5% |
| Immigrants | Ireland | 100.0 /100 | #21 | Exceptional 20.4% |
| Israelis | 100.0 /100 | #22 | Exceptional 20.3% |
| Immigrants | France | 100.0 /100 | #23 | Exceptional 20.3% |
| Immigrants | Sweden | 100.0 /100 | #24 | Exceptional 20.3% |
| Immigrants | Japan | 100.0 /100 | #25 | Exceptional 20.0% |
| Cambodians | 100.0 /100 | #26 | Exceptional 20.0% |
| Immigrants | Sri Lanka | 100.0 /100 | #27 | Exceptional 19.9% |
| Turks | 100.0 /100 | #28 | Exceptional 19.9% |
| Latvians | 100.0 /100 | #29 | Exceptional 19.8% |
| Immigrants | Turkey | 100.0 /100 | #30 | Exceptional 19.7% |
| Immigrants | Korea | 100.0 /100 | #31 | Exceptional 19.7% |
| Burmese | 100.0 /100 | #32 | Exceptional 19.7% |