Immigrants from Middle Africa vs Chickasaw Master's Degree
COMPARE
Immigrants from Middle Africa
Chickasaw
Master's Degree
Master's Degree Comparison
Immigrants from Middle Africa
Chickasaw
14.6%
MASTER'S DEGREE
33.6/ 100
METRIC RATING
192nd/ 347
METRIC RANK
11.4%
MASTER'S DEGREE
0.1/ 100
METRIC RATING
299th/ 347
METRIC RANK
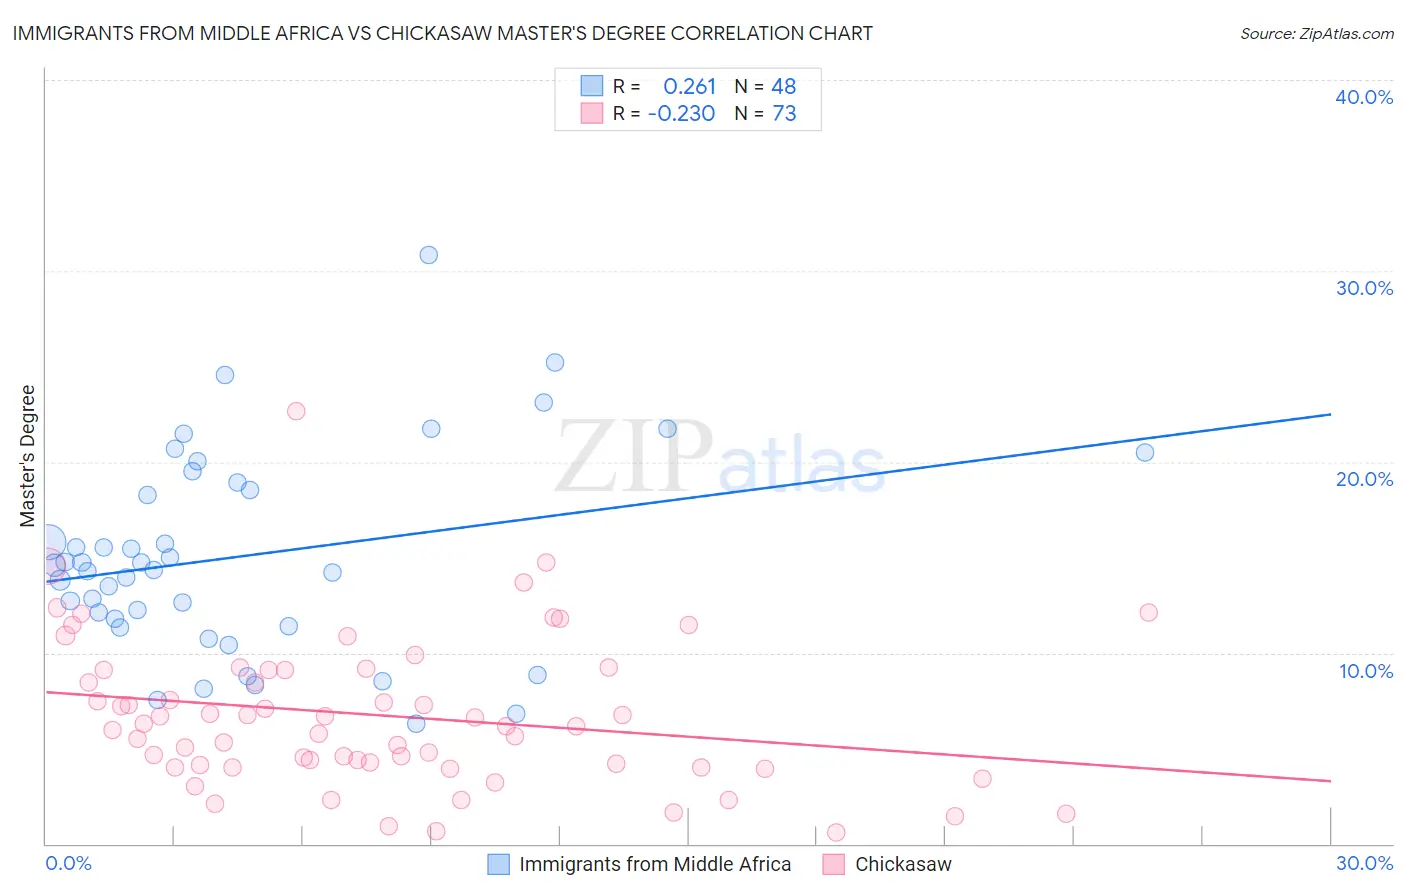
Immigrants from Middle Africa vs Chickasaw Master's Degree Correlation Chart
The statistical analysis conducted on geographies consisting of 202,718,309 people shows a weak positive correlation between the proportion of Immigrants from Middle Africa and percentage of population with at least master's degree education in the United States with a correlation coefficient (R) of 0.261 and weighted average of 14.6%. Similarly, the statistical analysis conducted on geographies consisting of 147,685,526 people shows a weak negative correlation between the proportion of Chickasaw and percentage of population with at least master's degree education in the United States with a correlation coefficient (R) of -0.230 and weighted average of 11.4%, a difference of 27.8%.
Master's Degree Correlation Summary
| Measurement | Immigrants from Middle Africa | Chickasaw |
| Minimum | 6.3% | 0.60% |
| Maximum | 30.8% | 22.7% |
| Range | 24.5% | 22.1% |
| Mean | 15.0% | 6.7% |
| Median | 14.5% | 6.1% |
| Interquartile 25% (IQ1) | 11.6% | 4.1% |
| Interquartile 75% (IQ3) | 18.7% | 9.1% |
| Interquartile Range (IQR) | 7.1% | 5.1% |
| Standard Deviation (Sample) | 5.3% | 3.9% |
| Standard Deviation (Population) | 5.2% | 3.9% |
Similar Demographics by Master's Degree
Demographics Similar to Immigrants from Middle Africa by Master's Degree
In terms of master's degree, the demographic groups most similar to Immigrants from Middle Africa are Welsh (14.6%, a difference of 0.090%), Immigrants from Nigeria (14.6%, a difference of 0.13%), Chinese (14.6%, a difference of 0.17%), Spaniard (14.6%, a difference of 0.31%), and Immigrants (14.6%, a difference of 0.34%).
| Demographics | Rating | Rank | Master's Degree |
| Barbadians | 38.3 /100 | #185 | Fair 14.7% |
| Immigrants | Oceania | 37.1 /100 | #186 | Fair 14.7% |
| Basques | 36.5 /100 | #187 | Fair 14.7% |
| Immigrants | Costa Rica | 36.2 /100 | #188 | Fair 14.7% |
| Immigrants | Immigrants | 36.0 /100 | #189 | Fair 14.6% |
| Spaniards | 35.8 /100 | #190 | Fair 14.6% |
| Welsh | 34.2 /100 | #191 | Fair 14.6% |
| Immigrants | Middle Africa | 33.6 /100 | #192 | Fair 14.6% |
| Immigrants | Nigeria | 32.7 /100 | #193 | Fair 14.6% |
| Chinese | 32.5 /100 | #194 | Fair 14.6% |
| Danes | 31.3 /100 | #195 | Fair 14.5% |
| Czechoslovakians | 29.9 /100 | #196 | Fair 14.5% |
| Belgians | 28.0 /100 | #197 | Fair 14.5% |
| West Indians | 27.4 /100 | #198 | Fair 14.5% |
| Immigrants | Armenia | 27.2 /100 | #199 | Fair 14.5% |
Demographics Similar to Chickasaw by Master's Degree
In terms of master's degree, the demographic groups most similar to Chickasaw are Chippewa (11.4%, a difference of 0.020%), Tsimshian (11.4%, a difference of 0.18%), Samoan (11.5%, a difference of 0.46%), Cherokee (11.4%, a difference of 0.49%), and Immigrants from Laos (11.4%, a difference of 0.51%).
| Demographics | Rating | Rank | Master's Degree |
| Immigrants | Guatemala | 0.1 /100 | #292 | Tragic 11.6% |
| Alaska Natives | 0.1 /100 | #293 | Tragic 11.6% |
| Hawaiians | 0.1 /100 | #294 | Tragic 11.6% |
| Marshallese | 0.1 /100 | #295 | Tragic 11.6% |
| Alaskan Athabascans | 0.1 /100 | #296 | Tragic 11.6% |
| Immigrants | Yemen | 0.1 /100 | #297 | Tragic 11.6% |
| Samoans | 0.1 /100 | #298 | Tragic 11.5% |
| Chickasaw | 0.1 /100 | #299 | Tragic 11.4% |
| Chippewa | 0.1 /100 | #300 | Tragic 11.4% |
| Tsimshian | 0.1 /100 | #301 | Tragic 11.4% |
| Cherokee | 0.1 /100 | #302 | Tragic 11.4% |
| Immigrants | Laos | 0.1 /100 | #303 | Tragic 11.4% |
| Immigrants | Cabo Verde | 0.1 /100 | #304 | Tragic 11.3% |
| Immigrants | Latin America | 0.0 /100 | #305 | Tragic 11.3% |
| Mexican American Indians | 0.0 /100 | #306 | Tragic 11.2% |