Immigrants from Middle Africa vs Spanish Master's Degree
COMPARE
Immigrants from Middle Africa
Spanish
Master's Degree
Master's Degree Comparison
Immigrants from Middle Africa
Spanish
14.6%
MASTER'S DEGREE
33.6/ 100
METRIC RATING
192nd/ 347
METRIC RANK
14.2%
MASTER'S DEGREE
17.8/ 100
METRIC RATING
212th/ 347
METRIC RANK
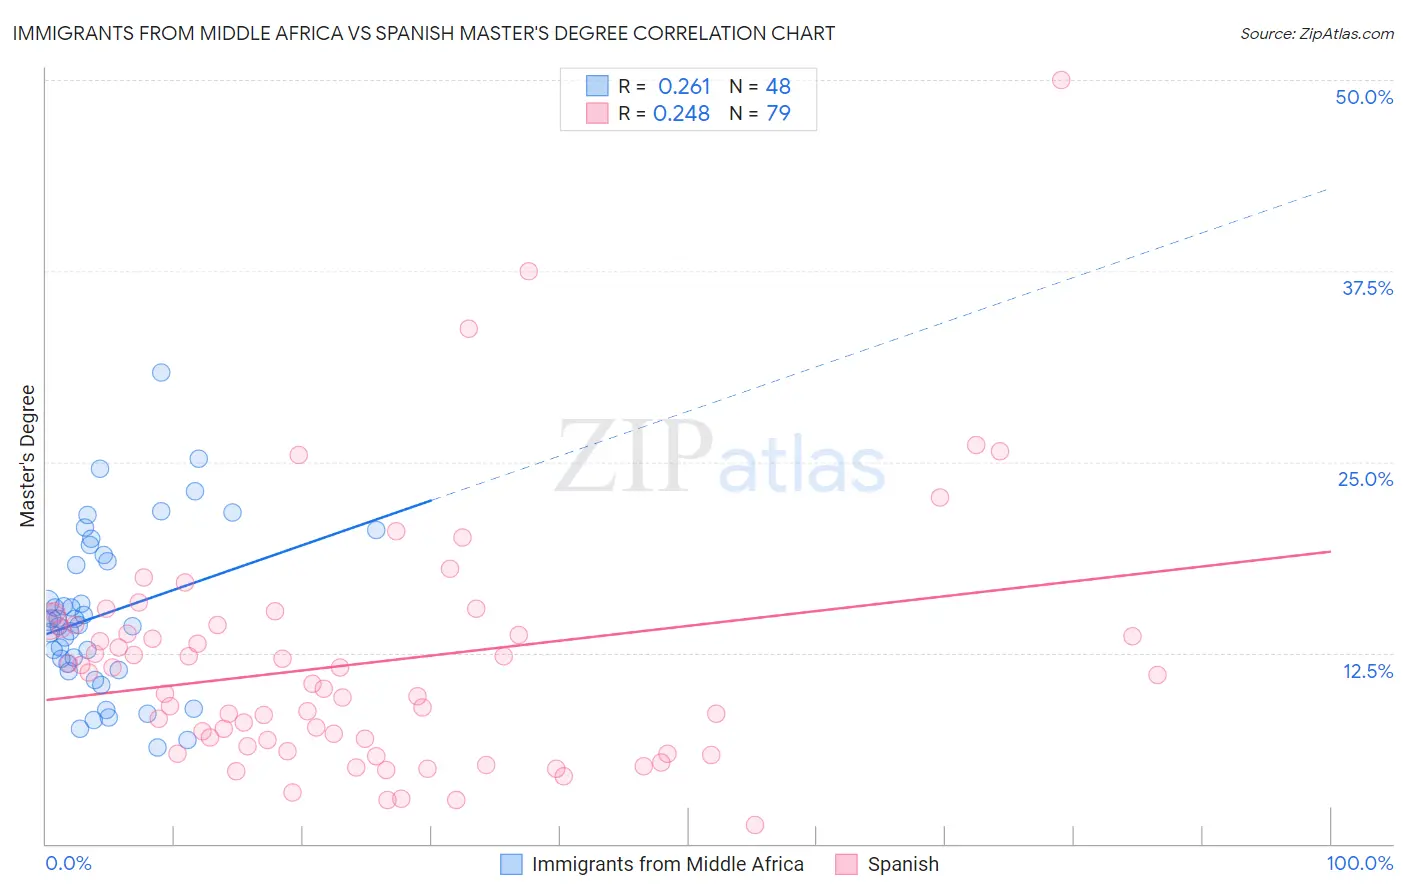
Immigrants from Middle Africa vs Spanish Master's Degree Correlation Chart
The statistical analysis conducted on geographies consisting of 202,718,309 people shows a weak positive correlation between the proportion of Immigrants from Middle Africa and percentage of population with at least master's degree education in the United States with a correlation coefficient (R) of 0.261 and weighted average of 14.6%. Similarly, the statistical analysis conducted on geographies consisting of 421,994,419 people shows a weak positive correlation between the proportion of Spanish and percentage of population with at least master's degree education in the United States with a correlation coefficient (R) of 0.248 and weighted average of 14.2%, a difference of 2.9%.
Master's Degree Correlation Summary
| Measurement | Immigrants from Middle Africa | Spanish |
| Minimum | 6.3% | 1.2% |
| Maximum | 30.8% | 50.0% |
| Range | 24.5% | 48.8% |
| Mean | 15.0% | 11.8% |
| Median | 14.5% | 10.5% |
| Interquartile 25% (IQ1) | 11.6% | 6.4% |
| Interquartile 75% (IQ3) | 18.7% | 14.3% |
| Interquartile Range (IQR) | 7.1% | 7.9% |
| Standard Deviation (Sample) | 5.3% | 8.0% |
| Standard Deviation (Population) | 5.2% | 7.9% |
Demographics Similar to Immigrants from Middle Africa and Spanish by Master's Degree
In terms of master's degree, the demographic groups most similar to Immigrants from Middle Africa are Immigrants from Nigeria (14.6%, a difference of 0.13%), Chinese (14.6%, a difference of 0.17%), Danish (14.5%, a difference of 0.35%), Czechoslovakian (14.5%, a difference of 0.57%), and Belgian (14.5%, a difference of 0.88%). Similarly, the demographic groups most similar to Spanish are Somali (14.2%, a difference of 0.050%), Subsaharan African (14.2%, a difference of 0.36%), Immigrants from Panama (14.3%, a difference of 0.49%), Immigrants from Barbados (14.3%, a difference of 0.58%), and Immigrants from Bosnia and Herzegovina (14.3%, a difference of 0.89%).
| Demographics | Rating | Rank | Master's Degree |
| Immigrants | Middle Africa | 33.6 /100 | #192 | Fair 14.6% |
| Immigrants | Nigeria | 32.7 /100 | #193 | Fair 14.6% |
| Chinese | 32.5 /100 | #194 | Fair 14.6% |
| Danes | 31.3 /100 | #195 | Fair 14.5% |
| Czechoslovakians | 29.9 /100 | #196 | Fair 14.5% |
| Belgians | 28.0 /100 | #197 | Fair 14.5% |
| West Indians | 27.4 /100 | #198 | Fair 14.5% |
| Immigrants | Armenia | 27.2 /100 | #199 | Fair 14.5% |
| Panamanians | 25.1 /100 | #200 | Fair 14.4% |
| Scotch-Irish | 25.0 /100 | #201 | Fair 14.4% |
| Immigrants | Western Africa | 24.9 /100 | #202 | Fair 14.4% |
| Yugoslavians | 24.3 /100 | #203 | Fair 14.4% |
| French | 23.7 /100 | #204 | Fair 14.4% |
| Trinidadians and Tobagonians | 23.5 /100 | #205 | Fair 14.4% |
| Scandinavians | 23.3 /100 | #206 | Fair 14.4% |
| Immigrants | Bosnia and Herzegovina | 22.0 /100 | #207 | Fair 14.3% |
| Immigrants | Barbados | 20.5 /100 | #208 | Fair 14.3% |
| Immigrants | Panama | 20.0 /100 | #209 | Fair 14.3% |
| Sub-Saharan Africans | 19.4 /100 | #210 | Poor 14.2% |
| Somalis | 18.0 /100 | #211 | Poor 14.2% |
| Spanish | 17.8 /100 | #212 | Poor 14.2% |