Immigrants from Micronesia vs Alaskan Athabascan 12th Grade, No Diploma
COMPARE
Immigrants from Micronesia
Alaskan Athabascan
12th Grade, No Diploma
12th Grade, No Diploma Comparison
Immigrants from Micronesia
Alaskan Athabascans
90.6%
12TH GRADE, NO DIPLOMA
11.0/ 100
METRIC RATING
208th/ 347
METRIC RANK
92.3%
12TH GRADE, NO DIPLOMA
98.1/ 100
METRIC RATING
102nd/ 347
METRIC RANK
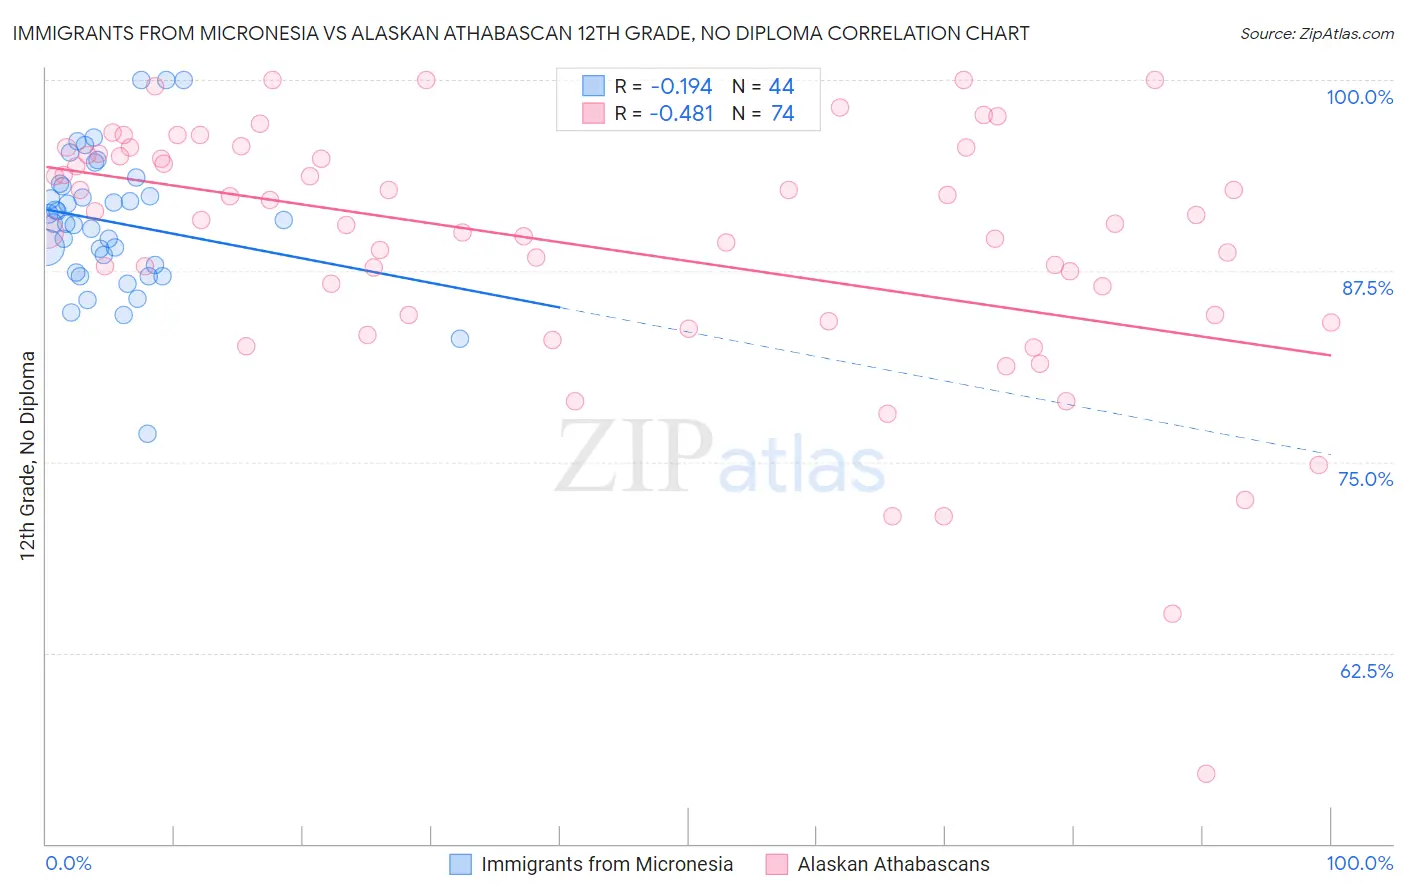
Immigrants from Micronesia vs Alaskan Athabascan 12th Grade, No Diploma Correlation Chart
The statistical analysis conducted on geographies consisting of 61,609,499 people shows a poor negative correlation between the proportion of Immigrants from Micronesia and percentage of population with at least 12th grade (no diploma) education in the United States with a correlation coefficient (R) of -0.194 and weighted average of 90.6%. Similarly, the statistical analysis conducted on geographies consisting of 45,820,221 people shows a moderate negative correlation between the proportion of Alaskan Athabascans and percentage of population with at least 12th grade (no diploma) education in the United States with a correlation coefficient (R) of -0.481 and weighted average of 92.3%, a difference of 1.9%.
12th Grade, No Diploma Correlation Summary
| Measurement | Immigrants from Micronesia | Alaskan Athabascan |
| Minimum | 76.9% | 54.5% |
| Maximum | 100.0% | 100.0% |
| Range | 23.1% | 45.5% |
| Mean | 90.7% | 89.1% |
| Median | 90.8% | 90.7% |
| Interquartile 25% (IQ1) | 87.7% | 84.6% |
| Interquartile 75% (IQ3) | 93.1% | 95.1% |
| Interquartile Range (IQR) | 5.5% | 10.5% |
| Standard Deviation (Sample) | 4.6% | 8.5% |
| Standard Deviation (Population) | 4.5% | 8.5% |
Similar Demographics by 12th Grade, No Diploma
Demographics Similar to Immigrants from Micronesia by 12th Grade, No Diploma
In terms of 12th grade, no diploma, the demographic groups most similar to Immigrants from Micronesia are Immigrants from Afghanistan (90.6%, a difference of 0.0%), South American Indian (90.6%, a difference of 0.0%), Portuguese (90.6%, a difference of 0.010%), Armenian (90.6%, a difference of 0.020%), and Somali (90.6%, a difference of 0.030%).
| Demographics | Rating | Rank | 12th Grade, No Diploma |
| Hawaiians | 19.7 /100 | #201 | Poor 90.8% |
| Marshallese | 18.2 /100 | #202 | Poor 90.7% |
| Tongans | 16.1 /100 | #203 | Poor 90.7% |
| French American Indians | 15.5 /100 | #204 | Poor 90.7% |
| Immigrants | Sierra Leone | 14.9 /100 | #205 | Poor 90.7% |
| Immigrants | Bolivia | 12.3 /100 | #206 | Poor 90.6% |
| Armenians | 11.6 /100 | #207 | Poor 90.6% |
| Immigrants | Micronesia | 11.0 /100 | #208 | Poor 90.6% |
| Immigrants | Afghanistan | 11.0 /100 | #209 | Poor 90.6% |
| South American Indians | 10.9 /100 | #210 | Poor 90.6% |
| Portuguese | 10.6 /100 | #211 | Poor 90.6% |
| Somalis | 10.2 /100 | #212 | Poor 90.6% |
| Costa Ricans | 9.4 /100 | #213 | Tragic 90.5% |
| Immigrants | Africa | 8.5 /100 | #214 | Tragic 90.5% |
| Arapaho | 7.7 /100 | #215 | Tragic 90.5% |
Demographics Similar to Alaskan Athabascans by 12th Grade, No Diploma
In terms of 12th grade, no diploma, the demographic groups most similar to Alaskan Athabascans are Swiss (92.3%, a difference of 0.0%), Immigrants from Norway (92.3%, a difference of 0.0%), Immigrants from Croatia (92.3%, a difference of 0.030%), Immigrants from Korea (92.3%, a difference of 0.040%), and Celtic (92.3%, a difference of 0.050%).
| Demographics | Rating | Rank | 12th Grade, No Diploma |
| Immigrants | North Macedonia | 98.5 /100 | #95 | Exceptional 92.3% |
| Icelanders | 98.5 /100 | #96 | Exceptional 92.3% |
| Celtics | 98.4 /100 | #97 | Exceptional 92.3% |
| Immigrants | Kuwait | 98.4 /100 | #98 | Exceptional 92.3% |
| Immigrants | Korea | 98.3 /100 | #99 | Exceptional 92.3% |
| Immigrants | Croatia | 98.3 /100 | #100 | Exceptional 92.3% |
| Swiss | 98.1 /100 | #101 | Exceptional 92.3% |
| Alaskan Athabascans | 98.1 /100 | #102 | Exceptional 92.3% |
| Immigrants | Norway | 98.1 /100 | #103 | Exceptional 92.3% |
| Lebanese | 97.6 /100 | #104 | Exceptional 92.2% |
| Immigrants | Belarus | 97.4 /100 | #105 | Exceptional 92.2% |
| Immigrants | Russia | 97.3 /100 | #106 | Exceptional 92.2% |
| Syrians | 97.2 /100 | #107 | Exceptional 92.2% |
| Jordanians | 97.2 /100 | #108 | Exceptional 92.2% |
| Immigrants | Hungary | 97.0 /100 | #109 | Exceptional 92.1% |