Immigrants from Micronesia vs Creek 12th Grade, No Diploma
COMPARE
Immigrants from Micronesia
Creek
12th Grade, No Diploma
12th Grade, No Diploma Comparison
Immigrants from Micronesia
Creek
90.6%
12TH GRADE, NO DIPLOMA
11.0/ 100
METRIC RATING
208th/ 347
METRIC RANK
90.3%
12TH GRADE, NO DIPLOMA
3.9/ 100
METRIC RATING
228th/ 347
METRIC RANK
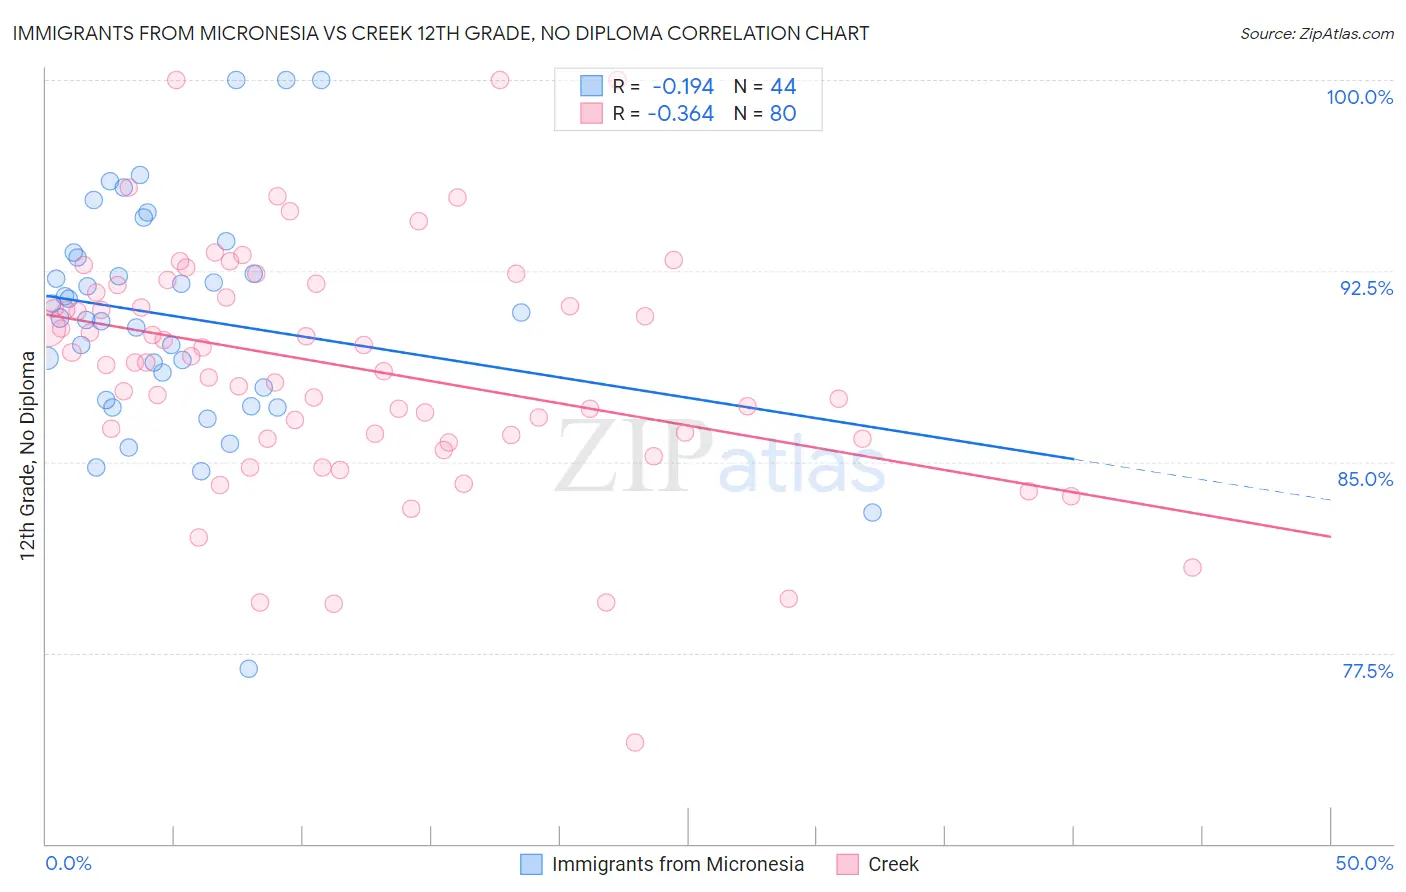
Immigrants from Micronesia vs Creek 12th Grade, No Diploma Correlation Chart
The statistical analysis conducted on geographies consisting of 61,609,499 people shows a poor negative correlation between the proportion of Immigrants from Micronesia and percentage of population with at least 12th grade (no diploma) education in the United States with a correlation coefficient (R) of -0.194 and weighted average of 90.6%. Similarly, the statistical analysis conducted on geographies consisting of 178,480,629 people shows a mild negative correlation between the proportion of Creek and percentage of population with at least 12th grade (no diploma) education in the United States with a correlation coefficient (R) of -0.364 and weighted average of 90.3%, a difference of 0.35%.
12th Grade, No Diploma Correlation Summary
| Measurement | Immigrants from Micronesia | Creek |
| Minimum | 76.9% | 74.0% |
| Maximum | 100.0% | 100.0% |
| Range | 23.1% | 26.0% |
| Mean | 90.7% | 88.7% |
| Median | 90.8% | 88.9% |
| Interquartile 25% (IQ1) | 87.7% | 86.0% |
| Interquartile 75% (IQ3) | 93.1% | 91.8% |
| Interquartile Range (IQR) | 5.5% | 5.8% |
| Standard Deviation (Sample) | 4.6% | 4.7% |
| Standard Deviation (Population) | 4.5% | 4.7% |
Demographics Similar to Immigrants from Micronesia and Creek by 12th Grade, No Diploma
In terms of 12th grade, no diploma, the demographic groups most similar to Immigrants from Micronesia are Immigrants from Afghanistan (90.6%, a difference of 0.0%), South American Indian (90.6%, a difference of 0.0%), Portuguese (90.6%, a difference of 0.010%), Somali (90.6%, a difference of 0.030%), and Costa Rican (90.5%, a difference of 0.060%). Similarly, the demographic groups most similar to Creek are Immigrants from Zaire (90.3%, a difference of 0.050%), Nigerian (90.3%, a difference of 0.050%), Immigrants from Panama (90.3%, a difference of 0.070%), Chickasaw (90.3%, a difference of 0.070%), and South American (90.3%, a difference of 0.080%).
| Demographics | Rating | Rank | 12th Grade, No Diploma |
| Immigrants | Micronesia | 11.0 /100 | #208 | Poor 90.6% |
| Immigrants | Afghanistan | 11.0 /100 | #209 | Poor 90.6% |
| South American Indians | 10.9 /100 | #210 | Poor 90.6% |
| Portuguese | 10.6 /100 | #211 | Poor 90.6% |
| Somalis | 10.2 /100 | #212 | Poor 90.6% |
| Costa Ricans | 9.4 /100 | #213 | Tragic 90.5% |
| Immigrants | Africa | 8.5 /100 | #214 | Tragic 90.5% |
| Arapaho | 7.7 /100 | #215 | Tragic 90.5% |
| Shoshone | 7.5 /100 | #216 | Tragic 90.5% |
| Cherokee | 7.4 /100 | #217 | Tragic 90.5% |
| Immigrants | Cameroon | 7.4 /100 | #218 | Tragic 90.5% |
| Uruguayans | 7.0 /100 | #219 | Tragic 90.4% |
| Colombians | 6.6 /100 | #220 | Tragic 90.4% |
| Immigrants | Liberia | 5.7 /100 | #221 | Tragic 90.4% |
| Immigrants | Somalia | 5.3 /100 | #222 | Tragic 90.4% |
| South Americans | 5.0 /100 | #223 | Tragic 90.3% |
| Immigrants | Panama | 4.8 /100 | #224 | Tragic 90.3% |
| Chickasaw | 4.8 /100 | #225 | Tragic 90.3% |
| Immigrants | Zaire | 4.6 /100 | #226 | Tragic 90.3% |
| Nigerians | 4.5 /100 | #227 | Tragic 90.3% |
| Creek | 3.9 /100 | #228 | Tragic 90.3% |