U.S. Virgin Islander vs Alaskan Athabascan 12th Grade, No Diploma
COMPARE
U.S. Virgin Islander
Alaskan Athabascan
12th Grade, No Diploma
12th Grade, No Diploma Comparison
U.S. Virgin Islanders
Alaskan Athabascans
89.3%
12TH GRADE, NO DIPLOMA
0.1/ 100
METRIC RATING
269th/ 347
METRIC RANK
92.3%
12TH GRADE, NO DIPLOMA
98.1/ 100
METRIC RATING
102nd/ 347
METRIC RANK
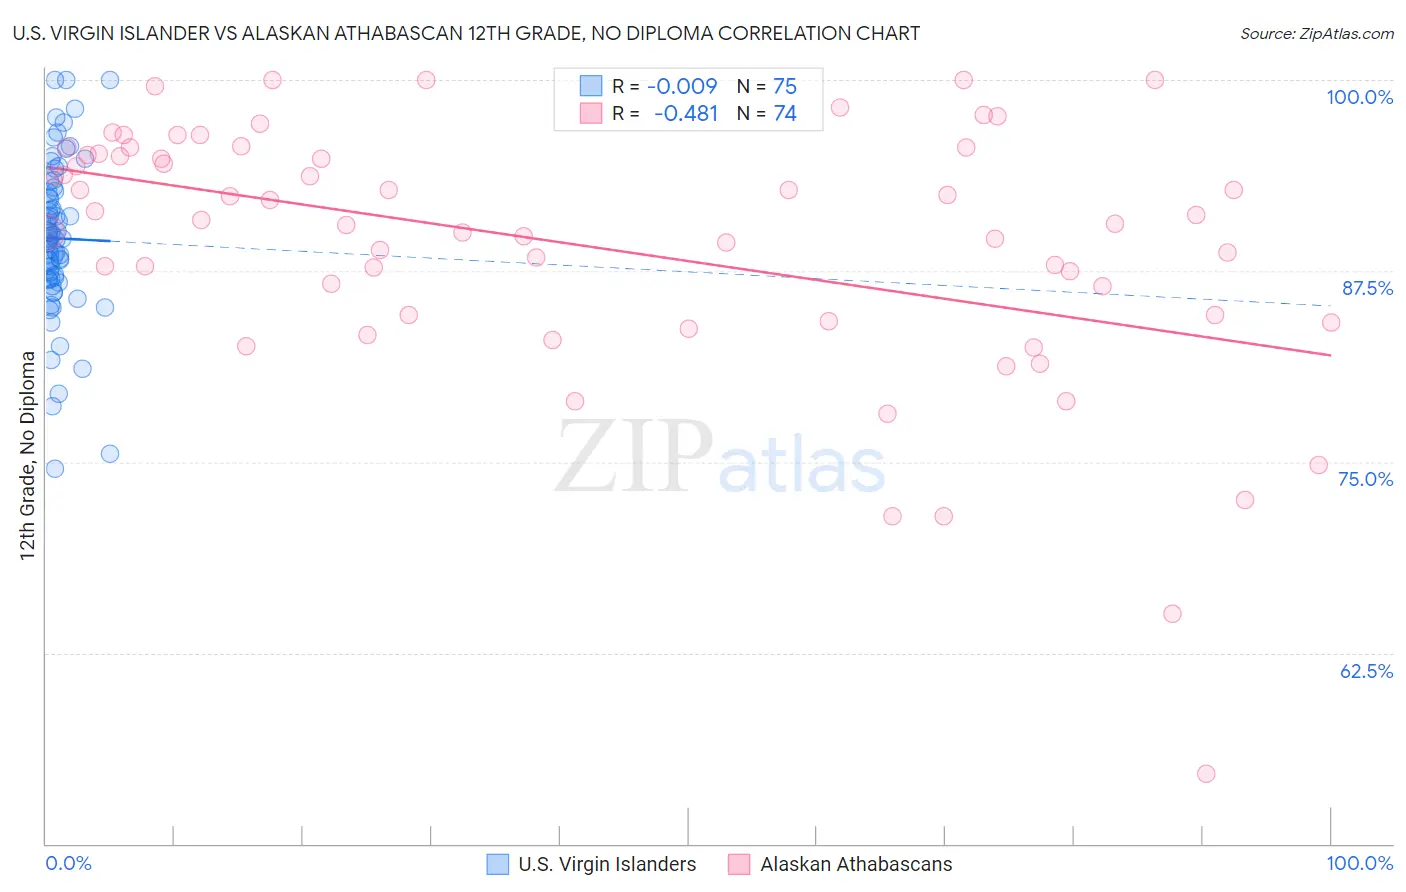
U.S. Virgin Islander vs Alaskan Athabascan 12th Grade, No Diploma Correlation Chart
The statistical analysis conducted on geographies consisting of 87,529,761 people shows no correlation between the proportion of U.S. Virgin Islanders and percentage of population with at least 12th grade (no diploma) education in the United States with a correlation coefficient (R) of -0.009 and weighted average of 89.3%. Similarly, the statistical analysis conducted on geographies consisting of 45,820,221 people shows a moderate negative correlation between the proportion of Alaskan Athabascans and percentage of population with at least 12th grade (no diploma) education in the United States with a correlation coefficient (R) of -0.481 and weighted average of 92.3%, a difference of 3.3%.
12th Grade, No Diploma Correlation Summary
| Measurement | U.S. Virgin Islander | Alaskan Athabascan |
| Minimum | 74.6% | 54.5% |
| Maximum | 100.0% | 100.0% |
| Range | 25.4% | 45.5% |
| Mean | 89.6% | 89.1% |
| Median | 89.6% | 90.7% |
| Interquartile 25% (IQ1) | 87.0% | 84.6% |
| Interquartile 75% (IQ3) | 92.7% | 95.1% |
| Interquartile Range (IQR) | 5.7% | 10.5% |
| Standard Deviation (Sample) | 5.1% | 8.5% |
| Standard Deviation (Population) | 5.1% | 8.5% |
Similar Demographics by 12th Grade, No Diploma
Demographics Similar to U.S. Virgin Islanders by 12th Grade, No Diploma
In terms of 12th grade, no diploma, the demographic groups most similar to U.S. Virgin Islanders are Immigrants from Trinidad and Tobago (89.3%, a difference of 0.040%), Bangladeshi (89.3%, a difference of 0.050%), Black/African American (89.3%, a difference of 0.050%), Seminole (89.4%, a difference of 0.060%), and West Indian (89.3%, a difference of 0.060%).
| Demographics | Rating | Rank | 12th Grade, No Diploma |
| Sioux | 0.4 /100 | #262 | Tragic 89.6% |
| Immigrants | Jamaica | 0.2 /100 | #263 | Tragic 89.5% |
| Sri Lankans | 0.2 /100 | #264 | Tragic 89.4% |
| Trinidadians and Tobagonians | 0.2 /100 | #265 | Tragic 89.4% |
| Seminole | 0.2 /100 | #266 | Tragic 89.4% |
| West Indians | 0.2 /100 | #267 | Tragic 89.3% |
| Immigrants | Trinidad and Tobago | 0.1 /100 | #268 | Tragic 89.3% |
| U.S. Virgin Islanders | 0.1 /100 | #269 | Tragic 89.3% |
| Bangladeshis | 0.1 /100 | #270 | Tragic 89.3% |
| Blacks/African Americans | 0.1 /100 | #271 | Tragic 89.3% |
| Malaysians | 0.1 /100 | #272 | Tragic 89.2% |
| Barbadians | 0.1 /100 | #273 | Tragic 89.1% |
| Cajuns | 0.1 /100 | #274 | Tragic 89.1% |
| Immigrants | Congo | 0.1 /100 | #275 | Tragic 89.0% |
| Ute | 0.1 /100 | #276 | Tragic 89.0% |
Demographics Similar to Alaskan Athabascans by 12th Grade, No Diploma
In terms of 12th grade, no diploma, the demographic groups most similar to Alaskan Athabascans are Swiss (92.3%, a difference of 0.0%), Immigrants from Norway (92.3%, a difference of 0.0%), Immigrants from Croatia (92.3%, a difference of 0.030%), Immigrants from Korea (92.3%, a difference of 0.040%), and Celtic (92.3%, a difference of 0.050%).
| Demographics | Rating | Rank | 12th Grade, No Diploma |
| Immigrants | North Macedonia | 98.5 /100 | #95 | Exceptional 92.3% |
| Icelanders | 98.5 /100 | #96 | Exceptional 92.3% |
| Celtics | 98.4 /100 | #97 | Exceptional 92.3% |
| Immigrants | Kuwait | 98.4 /100 | #98 | Exceptional 92.3% |
| Immigrants | Korea | 98.3 /100 | #99 | Exceptional 92.3% |
| Immigrants | Croatia | 98.3 /100 | #100 | Exceptional 92.3% |
| Swiss | 98.1 /100 | #101 | Exceptional 92.3% |
| Alaskan Athabascans | 98.1 /100 | #102 | Exceptional 92.3% |
| Immigrants | Norway | 98.1 /100 | #103 | Exceptional 92.3% |
| Lebanese | 97.6 /100 | #104 | Exceptional 92.2% |
| Immigrants | Belarus | 97.4 /100 | #105 | Exceptional 92.2% |
| Immigrants | Russia | 97.3 /100 | #106 | Exceptional 92.2% |
| Syrians | 97.2 /100 | #107 | Exceptional 92.2% |
| Jordanians | 97.2 /100 | #108 | Exceptional 92.2% |
| Immigrants | Hungary | 97.0 /100 | #109 | Exceptional 92.1% |