Tohono O'odham vs Alaskan Athabascan 12th Grade, No Diploma
COMPARE
Tohono O'odham
Alaskan Athabascan
12th Grade, No Diploma
12th Grade, No Diploma Comparison
Tohono O'odham
Alaskan Athabascans
84.7%
12TH GRADE, NO DIPLOMA
0.0/ 100
METRIC RATING
336th/ 347
METRIC RANK
92.3%
12TH GRADE, NO DIPLOMA
98.1/ 100
METRIC RATING
102nd/ 347
METRIC RANK
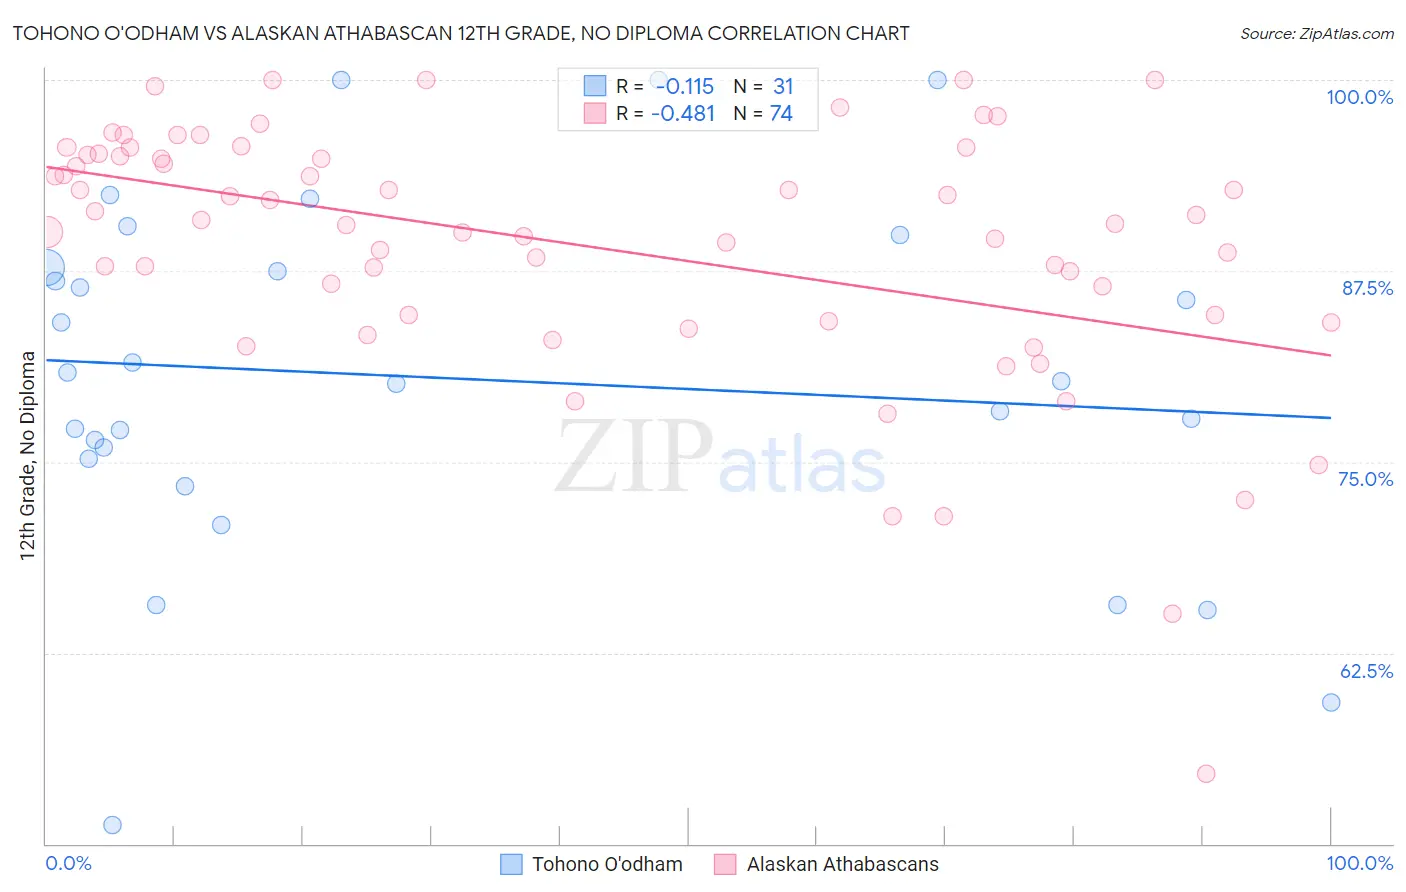
Tohono O'odham vs Alaskan Athabascan 12th Grade, No Diploma Correlation Chart
The statistical analysis conducted on geographies consisting of 58,730,615 people shows a poor negative correlation between the proportion of Tohono O'odham and percentage of population with at least 12th grade (no diploma) education in the United States with a correlation coefficient (R) of -0.115 and weighted average of 84.7%. Similarly, the statistical analysis conducted on geographies consisting of 45,820,221 people shows a moderate negative correlation between the proportion of Alaskan Athabascans and percentage of population with at least 12th grade (no diploma) education in the United States with a correlation coefficient (R) of -0.481 and weighted average of 92.3%, a difference of 8.9%.
12th Grade, No Diploma Correlation Summary
| Measurement | Tohono O'odham | Alaskan Athabascan |
| Minimum | 51.2% | 54.5% |
| Maximum | 100.0% | 100.0% |
| Range | 48.8% | 45.5% |
| Mean | 80.5% | 89.1% |
| Median | 80.3% | 90.7% |
| Interquartile 25% (IQ1) | 75.2% | 84.6% |
| Interquartile 75% (IQ3) | 87.7% | 95.1% |
| Interquartile Range (IQR) | 12.5% | 10.5% |
| Standard Deviation (Sample) | 11.6% | 8.5% |
| Standard Deviation (Population) | 11.4% | 8.5% |
Similar Demographics by 12th Grade, No Diploma
Demographics Similar to Tohono O'odham by 12th Grade, No Diploma
In terms of 12th grade, no diploma, the demographic groups most similar to Tohono O'odham are Pima (84.6%, a difference of 0.13%), Immigrants from Yemen (84.8%, a difference of 0.14%), Immigrants from Dominican Republic (84.9%, a difference of 0.18%), Guatemalan (84.6%, a difference of 0.18%), and Salvadoran (84.5%, a difference of 0.27%).
| Demographics | Rating | Rank | 12th Grade, No Diploma |
| Hispanics or Latinos | 0.0 /100 | #329 | Tragic 85.4% |
| Immigrants | Azores | 0.0 /100 | #330 | Tragic 85.3% |
| Central Americans | 0.0 /100 | #331 | Tragic 85.2% |
| Immigrants | Honduras | 0.0 /100 | #332 | Tragic 85.0% |
| Immigrants | Latin America | 0.0 /100 | #333 | Tragic 85.0% |
| Immigrants | Dominican Republic | 0.0 /100 | #334 | Tragic 84.9% |
| Immigrants | Yemen | 0.0 /100 | #335 | Tragic 84.8% |
| Tohono O'odham | 0.0 /100 | #336 | Tragic 84.7% |
| Pima | 0.0 /100 | #337 | Tragic 84.6% |
| Guatemalans | 0.0 /100 | #338 | Tragic 84.6% |
| Salvadorans | 0.0 /100 | #339 | Tragic 84.5% |
| Mexicans | 0.0 /100 | #340 | Tragic 84.1% |
| Immigrants | Guatemala | 0.0 /100 | #341 | Tragic 84.0% |
| Houma | 0.0 /100 | #342 | Tragic 83.7% |
| Immigrants | El Salvador | 0.0 /100 | #343 | Tragic 83.6% |
Demographics Similar to Alaskan Athabascans by 12th Grade, No Diploma
In terms of 12th grade, no diploma, the demographic groups most similar to Alaskan Athabascans are Swiss (92.3%, a difference of 0.0%), Immigrants from Norway (92.3%, a difference of 0.0%), Immigrants from Croatia (92.3%, a difference of 0.030%), Immigrants from Korea (92.3%, a difference of 0.040%), and Celtic (92.3%, a difference of 0.050%).
| Demographics | Rating | Rank | 12th Grade, No Diploma |
| Immigrants | North Macedonia | 98.5 /100 | #95 | Exceptional 92.3% |
| Icelanders | 98.5 /100 | #96 | Exceptional 92.3% |
| Celtics | 98.4 /100 | #97 | Exceptional 92.3% |
| Immigrants | Kuwait | 98.4 /100 | #98 | Exceptional 92.3% |
| Immigrants | Korea | 98.3 /100 | #99 | Exceptional 92.3% |
| Immigrants | Croatia | 98.3 /100 | #100 | Exceptional 92.3% |
| Swiss | 98.1 /100 | #101 | Exceptional 92.3% |
| Alaskan Athabascans | 98.1 /100 | #102 | Exceptional 92.3% |
| Immigrants | Norway | 98.1 /100 | #103 | Exceptional 92.3% |
| Lebanese | 97.6 /100 | #104 | Exceptional 92.2% |
| Immigrants | Belarus | 97.4 /100 | #105 | Exceptional 92.2% |
| Immigrants | Russia | 97.3 /100 | #106 | Exceptional 92.2% |
| Syrians | 97.2 /100 | #107 | Exceptional 92.2% |
| Jordanians | 97.2 /100 | #108 | Exceptional 92.2% |
| Immigrants | Hungary | 97.0 /100 | #109 | Exceptional 92.1% |