Immigrants from Switzerland vs Alaskan Athabascan 12th Grade, No Diploma
COMPARE
Immigrants from Switzerland
Alaskan Athabascan
12th Grade, No Diploma
12th Grade, No Diploma Comparison
Immigrants from Switzerland
Alaskan Athabascans
92.5%
12TH GRADE, NO DIPLOMA
99.2/ 100
METRIC RATING
82nd/ 347
METRIC RANK
92.3%
12TH GRADE, NO DIPLOMA
98.1/ 100
METRIC RATING
102nd/ 347
METRIC RANK
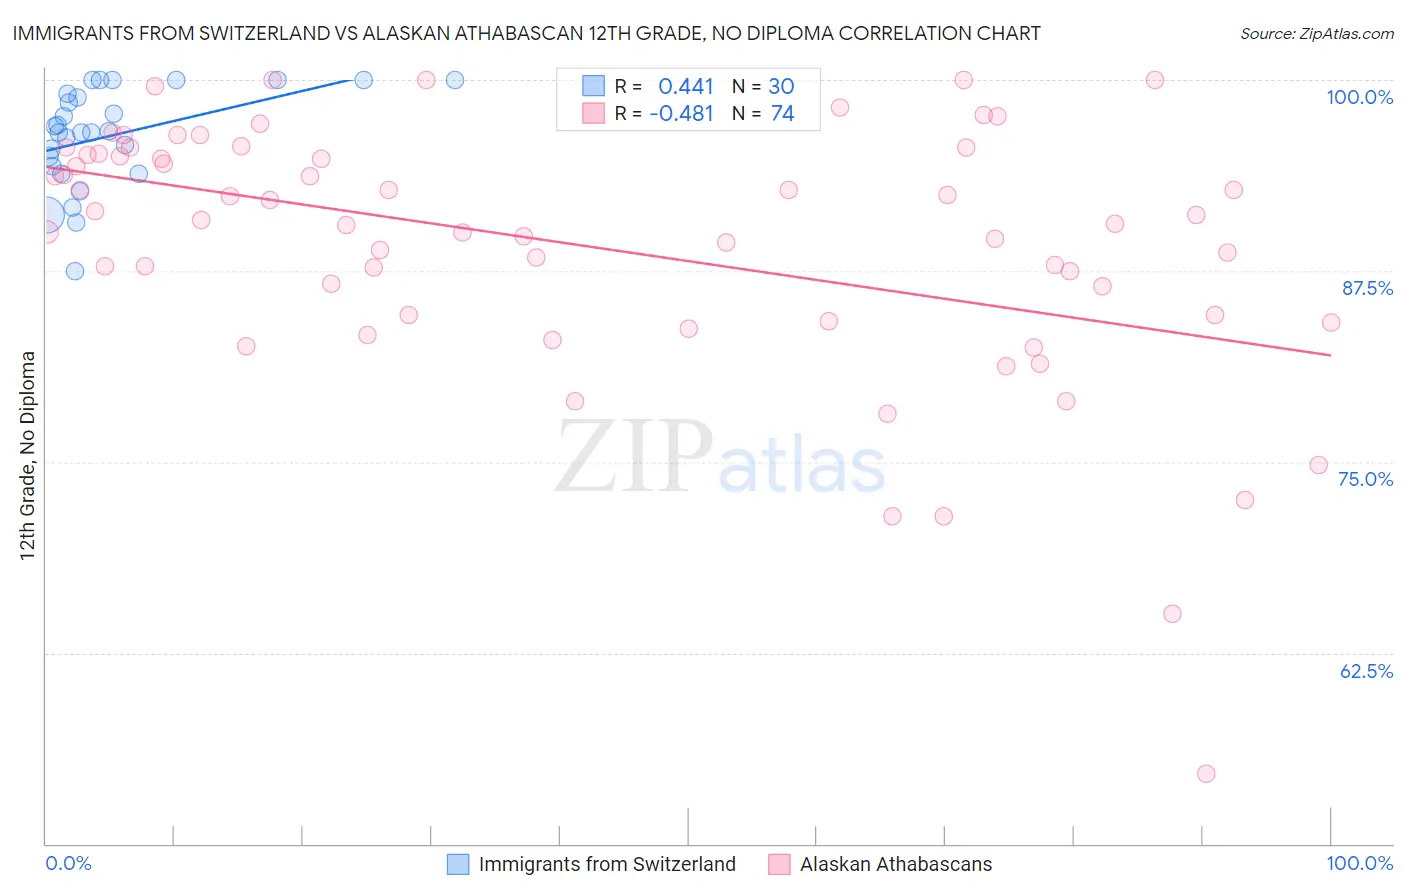
Immigrants from Switzerland vs Alaskan Athabascan 12th Grade, No Diploma Correlation Chart
The statistical analysis conducted on geographies consisting of 148,083,583 people shows a moderate positive correlation between the proportion of Immigrants from Switzerland and percentage of population with at least 12th grade (no diploma) education in the United States with a correlation coefficient (R) of 0.441 and weighted average of 92.5%. Similarly, the statistical analysis conducted on geographies consisting of 45,820,221 people shows a moderate negative correlation between the proportion of Alaskan Athabascans and percentage of population with at least 12th grade (no diploma) education in the United States with a correlation coefficient (R) of -0.481 and weighted average of 92.3%, a difference of 0.28%.
12th Grade, No Diploma Correlation Summary
| Measurement | Immigrants from Switzerland | Alaskan Athabascan |
| Minimum | 87.5% | 54.5% |
| Maximum | 100.0% | 100.0% |
| Range | 12.5% | 45.5% |
| Mean | 96.3% | 89.1% |
| Median | 96.6% | 90.7% |
| Interquartile 25% (IQ1) | 94.3% | 84.6% |
| Interquartile 75% (IQ3) | 99.1% | 95.1% |
| Interquartile Range (IQR) | 4.8% | 10.5% |
| Standard Deviation (Sample) | 3.3% | 8.5% |
| Standard Deviation (Population) | 3.2% | 8.5% |
Demographics Similar to Immigrants from Switzerland and Alaskan Athabascans by 12th Grade, No Diploma
In terms of 12th grade, no diploma, the demographic groups most similar to Immigrants from Switzerland are Immigrants from Israel (92.5%, a difference of 0.010%), Immigrants from Bulgaria (92.5%, a difference of 0.060%), Immigrants from Saudi Arabia (92.5%, a difference of 0.070%), Immigrants from Turkey (92.4%, a difference of 0.12%), and Immigrants from France (92.4%, a difference of 0.14%). Similarly, the demographic groups most similar to Alaskan Athabascans are Swiss (92.3%, a difference of 0.0%), Immigrants from Croatia (92.3%, a difference of 0.030%), Immigrants from Korea (92.3%, a difference of 0.040%), Celtic (92.3%, a difference of 0.050%), and Immigrants from Kuwait (92.3%, a difference of 0.050%).
| Demographics | Rating | Rank | 12th Grade, No Diploma |
| Immigrants | Switzerland | 99.2 /100 | #82 | Exceptional 92.5% |
| Immigrants | Israel | 99.2 /100 | #83 | Exceptional 92.5% |
| Immigrants | Bulgaria | 99.1 /100 | #84 | Exceptional 92.5% |
| Immigrants | Saudi Arabia | 99.0 /100 | #85 | Exceptional 92.5% |
| Immigrants | Turkey | 98.9 /100 | #86 | Exceptional 92.4% |
| Immigrants | France | 98.8 /100 | #87 | Exceptional 92.4% |
| Scotch-Irish | 98.8 /100 | #88 | Exceptional 92.4% |
| Canadians | 98.7 /100 | #89 | Exceptional 92.4% |
| Immigrants | Serbia | 98.6 /100 | #90 | Exceptional 92.4% |
| South Africans | 98.6 /100 | #91 | Exceptional 92.4% |
| Immigrants | Romania | 98.5 /100 | #92 | Exceptional 92.3% |
| Immigrants | Western Europe | 98.5 /100 | #93 | Exceptional 92.3% |
| Immigrants | Europe | 98.5 /100 | #94 | Exceptional 92.3% |
| Immigrants | North Macedonia | 98.5 /100 | #95 | Exceptional 92.3% |
| Icelanders | 98.5 /100 | #96 | Exceptional 92.3% |
| Celtics | 98.4 /100 | #97 | Exceptional 92.3% |
| Immigrants | Kuwait | 98.4 /100 | #98 | Exceptional 92.3% |
| Immigrants | Korea | 98.3 /100 | #99 | Exceptional 92.3% |
| Immigrants | Croatia | 98.3 /100 | #100 | Exceptional 92.3% |
| Swiss | 98.1 /100 | #101 | Exceptional 92.3% |
| Alaskan Athabascans | 98.1 /100 | #102 | Exceptional 92.3% |