Immigrants from Micronesia vs Immigrants from Eastern Asia 12th Grade, No Diploma

COMPARE

Immigrants from Micronesia
Race
Ancestry
AfghanAfricanAlaska NativeAlaskan AthabascanAlbanianAleutAlsatianAmericanApacheArabArapahoArgentineanArmenianAssyrian/Chaldean/SyriacAustralianAustrianBahamianBangladeshiBarbadianBasqueBelgianBelizeanBermudanBhutaneseBlackfeetBolivianBrazilianBritishBritish West IndianBulgarianBurmeseCajunCambodianCanadianCape VerdeanCarpatho RusynCelticCentral AmericanCentral American IndianCherokeeCheyenneChickasawChileanChineseChippewaChoctawColombianColvilleComancheCosta RicanCreeCreekCroatianCrowCubanCypriotCzechCzechoslovakianDanishDelawareDominicanDutchDutch West IndianEastern EuropeanEcuadorianEgyptianEnglishEstonianEthiopianEuropeanFijianFilipinoFinnishFrenchFrench American IndianFrench CanadianGermanGerman RussianGhanaianGreekGuamanian/ChamorroGuatemalanGuyaneseHaitianHmongHonduranHopiHoumaHungarianIcelanderIndian (Asian)IndonesianInupiatIranianIraqiIrishIroquoisIsraeliItalianJamaicanJapaneseJordanianKenyanKiowaKoreanLaotianLatvianLebaneseLiberianLithuanianLumbeeLuxembourgerMacedonianMalaysianMalteseMarshalleseMenomineeMexicanMexican American IndianMongolianMoroccanNative HawaiianNavajoNepaleseNew ZealanderNicaraguanNigerianNorthern EuropeanNorwegianOkinawanOsageOttawaPaiutePakistaniPalestinianPanamanianParaguayanPennsylvania GermanPeruvianPimaPolishPortuguesePotawatomiPuebloPuerto RicanPuget Sound SalishRomanianRussianSalvadoranSamoanScandinavianScotch-IrishScottishSeminoleSenegaleseSerbianShoshoneSierra LeoneanSiouxSlavicSlovakSloveneSomaliSouth AfricanSouth AmericanSouth American IndianSoviet UnionSpaniardSpanishSpanish AmericanSpanish American IndianSri LankanSubsaharan AfricanSudaneseSwedishSwissSyrianTaiwaneseThaiTlingit-HaidaTohono O'OdhamTonganTrinidadian and TobagonianTsimshianTurkishU.S. Virgin IslanderUgandanUkrainianUruguayanUteVenezuelanVietnameseWelshWest IndianYakamaYaquiYugoslavianYumanYup'ikZimbabwean
Immigration
NonimmigrantsImmigrantsAfghanistanAfricaAlbaniaArgentinaArmeniaAsiaAustraliaAustriaBahamasBangladeshBarbadosBelarusBelgiumBelizeBoliviaBosnia and HerzegovinaBrazilBulgariaBurma/MyanmarCabo VerdeCambodiaCameroonCanadaCaribbeanCentral AmericaChileChinaColombiaCongoCosta RicaCroatiaCubaCzechoslovakiaDenmarkDominicaDominican RepublicEastern AfricaEastern EuropeEcuadorEgyptEl SalvadorEnglandEritreaEthiopiaEuropeFijiFranceGermanyGhanaGreeceGrenadaGuatemalaGuyanaHaitiHondurasHong KongHungaryIndiaIndonesiaIranIraqIrelandIsraelItalyJamaicaJapanJordanKazakhstanKenyaKoreaKuwaitLaosLatin AmericaLatviaLebanonLiberiaLithuaniaMalaysiaMexicoMicronesiaMiddle AfricaMoldovaMoroccoNepalNetherlandsNicaraguaNigeriaNorth AmericaNorth MacedoniaNorthern AfricaNorthern EuropeNorwayOceaniaPakistanPanamaPeruPhilippinesPolandPortugalRomaniaRussiaSaudi ArabiaScotlandSenegalSerbiaSierra LeoneSingaporeSomaliaSouth AfricaSouth AmericaSouth Central AsiaSouth Eastern AsiaSouthern EuropeSpainSri LankaSt. Vincent and the GrenadinesSudanSwedenSwitzerlandSyriaTaiwanThailandTrinidad and TobagoTurkeyUgandaUkraineUruguayUzbekistanVenezuelaVietnamWest IndiesWestern AfricaWestern AsiaWestern EuropeYemenZaireZimbabweAzores
Immigrants from Eastern Asia
Race
Ancestry
AfghanAfricanAlaska NativeAlaskan AthabascanAlbanianAleutAlsatianAmericanApacheArabArapahoArgentineanArmenianAssyrian/Chaldean/SyriacAustralianAustrianBahamianBangladeshiBarbadianBasqueBelgianBelizeanBermudanBhutaneseBlackfeetBolivianBrazilianBritishBritish West IndianBulgarianBurmeseCajunCambodianCanadianCape VerdeanCarpatho RusynCelticCentral AmericanCentral American IndianCherokeeCheyenneChickasawChileanChineseChippewaChoctawColombianColvilleComancheCosta RicanCreeCreekCroatianCrowCubanCypriotCzechCzechoslovakianDanishDelawareDominicanDutchDutch West IndianEastern EuropeanEcuadorianEgyptianEnglishEstonianEthiopianEuropeanFijianFilipinoFinnishFrenchFrench American IndianFrench CanadianGermanGerman RussianGhanaianGreekGuamanian/ChamorroGuatemalanGuyaneseHaitianHmongHonduranHopiHoumaHungarianIcelanderIndian (Asian)IndonesianInupiatIranianIraqiIrishIroquoisIsraeliItalianJamaicanJapaneseJordanianKenyanKiowaKoreanLaotianLatvianLebaneseLiberianLithuanianLumbeeLuxembourgerMacedonianMalaysianMalteseMarshalleseMenomineeMexicanMexican American IndianMongolianMoroccanNative HawaiianNavajoNepaleseNew ZealanderNicaraguanNigerianNorthern EuropeanNorwegianOkinawanOsageOttawaPaiutePakistaniPalestinianPanamanianParaguayanPennsylvania GermanPeruvianPimaPolishPortuguesePotawatomiPuebloPuerto RicanPuget Sound SalishRomanianRussianSalvadoranSamoanScandinavianScotch-IrishScottishSeminoleSenegaleseSerbianShoshoneSierra LeoneanSiouxSlavicSlovakSloveneSomaliSouth AfricanSouth AmericanSouth American IndianSoviet UnionSpaniardSpanishSpanish AmericanSpanish American IndianSri LankanSubsaharan AfricanSudaneseSwedishSwissSyrianTaiwaneseThaiTlingit-HaidaTohono O'OdhamTonganTrinidadian and TobagonianTsimshianTurkishU.S. Virgin IslanderUgandanUkrainianUruguayanUteVenezuelanVietnameseWelshWest IndianYakamaYaquiYugoslavianYumanYup'ikZimbabwean
Immigration
NonimmigrantsImmigrantsAfghanistanAfricaAlbaniaArgentinaArmeniaAsiaAustraliaAustriaBahamasBangladeshBarbadosBelarusBelgiumBelizeBoliviaBosnia and HerzegovinaBrazilBulgariaBurma/MyanmarCabo VerdeCambodiaCameroonCanadaCaribbeanCentral AmericaChileChinaColombiaCongoCosta RicaCroatiaCubaCzechoslovakiaDenmarkDominicaDominican RepublicEastern AfricaEastern AsiaEastern EuropeEcuadorEgyptEl SalvadorEnglandEritreaEthiopiaEuropeFijiFranceGermanyGhanaGreeceGrenadaGuatemalaGuyanaHaitiHondurasHong KongHungaryIndiaIndonesiaIranIraqIrelandIsraelItalyJamaicaJapanJordanKazakhstanKenyaKoreaKuwaitLaosLatin AmericaLatviaLebanonLiberiaLithuaniaMalaysiaMexicoMiddle AfricaMoldovaMoroccoNepalNetherlandsNicaraguaNigeriaNorth AmericaNorth MacedoniaNorthern AfricaNorthern EuropeNorwayOceaniaPakistanPanamaPeruPhilippinesPolandPortugalRomaniaRussiaSaudi ArabiaScotlandSenegalSerbiaSierra LeoneSingaporeSomaliaSouth AfricaSouth AmericaSouth Central AsiaSouth Eastern AsiaSouthern EuropeSpainSri LankaSt. Vincent and the GrenadinesSudanSwedenSwitzerlandSyriaTaiwanThailandTrinidad and TobagoTurkeyUgandaUkraineUruguayUzbekistanVenezuelaVietnamWest IndiesWestern AfricaWestern AsiaWestern EuropeYemenZaireZimbabweAzores
12th Grade, No Diploma
Income
Poverty
Unemployment
Labor Participation
Family Structure
Vehicle Availability
Education Level
Disability

12th Grade, No Diploma Comparison

Immigrants from Micronesia

Immigrants from Eastern Asia

Poor
Excellent
90.6%
12TH GRADE, NO DIPLOMA
11.0/ 100
METRIC RATING
208th/ 347
METRIC RANK
91.8%
12TH GRADE, NO DIPLOMA
89.3/ 100
METRIC RATING
132nd/ 347
METRIC RANK

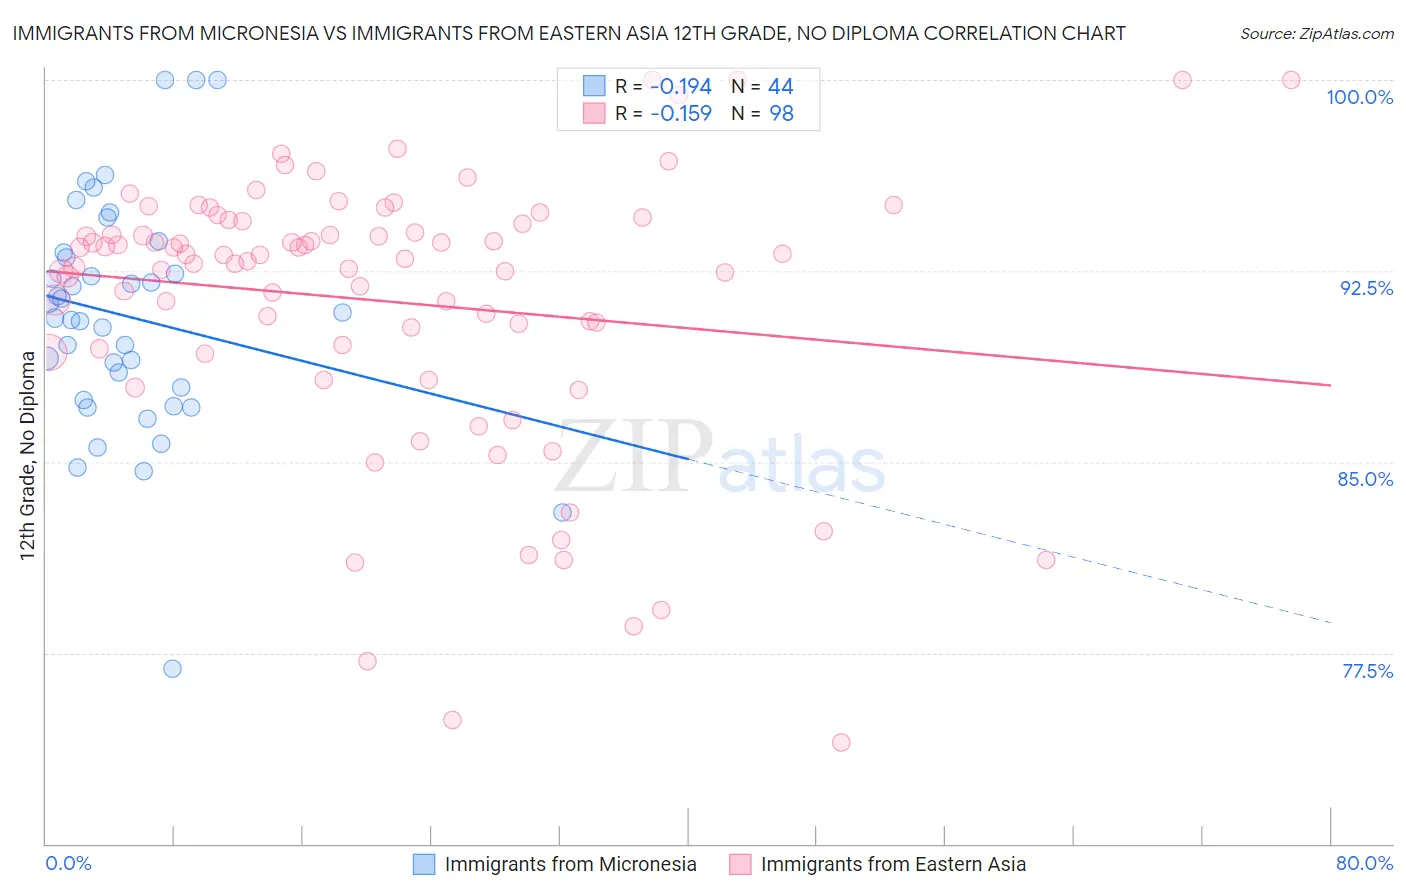
Immigrants from Micronesia vs Immigrants from Eastern Asia 12th Grade, No Diploma Correlation Chart

The statistical analysis conducted on geographies consisting of 61,609,499 people shows a poor negative correlation between the proportion of Immigrants from Micronesia and percentage of population with at least 12th grade (no diploma) education in the United States with a correlation coefficient (R) of -0.194 and weighted average of 90.6%. Similarly, the statistical analysis conducted on geographies consisting of 499,846,284 people shows a poor negative correlation between the proportion of Immigrants from Eastern Asia and percentage of population with at least 12th grade (no diploma) education in the United States with a correlation coefficient (R) of -0.159 and weighted average of 91.8%, a difference of 1.3%.
Immigrants from Micronesia vs Immigrants from Eastern Asia 12th Grade, No Diploma

12th Grade, No Diploma Correlation Summary

MeasurementImmigrants from MicronesiaImmigrants from Eastern Asia
Minimum76.9%74.0%
Maximum100.0%100.0%
Range23.1%26.0%
Mean90.7%91.3%
Median90.8%93.1%
Interquartile 25% (IQ1)87.7%89.5%
Interquartile 75% (IQ3)93.1%94.4%
Interquartile Range (IQR)5.5%5.0%
Standard Deviation (Sample)4.6%5.4%
Standard Deviation (Population)4.5%5.4%

Similar Demographics by 12th Grade, No Diploma

Demographics Similar to Immigrants from Micronesia by 12th Grade, No Diploma

In terms of 12th grade, no diploma, the demographic groups most similar to Immigrants from Micronesia are Immigrants from Afghanistan (90.6%, a difference of 0.0%), South American Indian (90.6%, a difference of 0.0%), Portuguese (90.6%, a difference of 0.010%), Armenian (90.6%, a difference of 0.020%), and Somali (90.6%, a difference of 0.030%).
DemographicsRating | Rank12th Grade, No Diploma
Hawaiians
19.7
/100
|
#201
Poor
90.8%
Marshallese
18.2
/100
|
#202
Poor
90.7%
Tongans
16.1
/100
|
#203
Poor
90.7%
French American Indians
15.5
/100
|
#204
Poor
90.7%
Immigrants | Sierra Leone
14.9
/100
|
#205
Poor
90.7%
Immigrants | Bolivia
12.3
/100
|
#206
Poor
90.6%
Armenians
11.6
/100
|
#207
Poor
90.6%
Immigrants | Micronesia
11.0
/100
|
#208
Poor
90.6%
Immigrants | Afghanistan
11.0
/100
|
#209
Poor
90.6%
South American Indians
10.9
/100
|
#210
Poor
90.6%
Portuguese
10.6
/100
|
#211
Poor
90.6%
Somalis
10.2
/100
|
#212
Poor
90.6%
Costa Ricans
9.4
/100
|
#213
Tragic
90.5%
Immigrants | Africa
8.5
/100
|
#214
Tragic
90.5%
Arapaho
7.7
/100
|
#215
Tragic
90.5%

Demographics Similar to Immigrants from Eastern Asia by 12th Grade, No Diploma

In terms of 12th grade, no diploma, the demographic groups most similar to Immigrants from Eastern Asia are Albanian (91.8%, a difference of 0.0%), Assyrian/Chaldean/Syriac (91.8%, a difference of 0.010%), Mongolian (91.8%, a difference of 0.020%), German Russian (91.8%, a difference of 0.020%), and Immigrants from Italy (91.7%, a difference of 0.030%).
DemographicsRating | Rank12th Grade, No Diploma
Whites/Caucasians
91.6
/100
|
#125
Exceptional
91.8%
Basques
91.3
/100
|
#126
Exceptional
91.8%
Immigrants | Jordan
91.0
/100
|
#127
Exceptional
91.8%
Mongolians
89.9
/100
|
#128
Excellent
91.8%
German Russians
89.8
/100
|
#129
Excellent
91.8%
Assyrians/Chaldeans/Syriacs
89.6
/100
|
#130
Excellent
91.8%
Albanians
89.3
/100
|
#131
Excellent
91.8%
Immigrants | Eastern Asia
89.3
/100
|
#132
Excellent
91.8%
Immigrants | Italy
88.3
/100
|
#133
Excellent
91.7%
Venezuelans
88.2
/100
|
#134
Excellent
91.7%
Immigrants | Bosnia and Herzegovina
87.3
/100
|
#135
Excellent
91.7%
Chileans
85.8
/100
|
#136
Excellent
91.7%
Alaska Natives
84.9
/100
|
#137
Excellent
91.6%
Arabs
84.1
/100
|
#138
Excellent
91.6%
Immigrants | Egypt
83.9
/100
|
#139
Excellent
91.6%