Immigrants from Latvia vs Guyanese GED/Equivalency
COMPARE
Immigrants from Latvia
Guyanese
GED/Equivalency
GED/Equivalency Comparison
Immigrants from Latvia
Guyanese
88.1%
GED/EQUIVALENCY
99.5/ 100
METRIC RATING
47th/ 347
METRIC RANK
81.3%
GED/EQUIVALENCY
0.0/ 100
METRIC RATING
306th/ 347
METRIC RANK
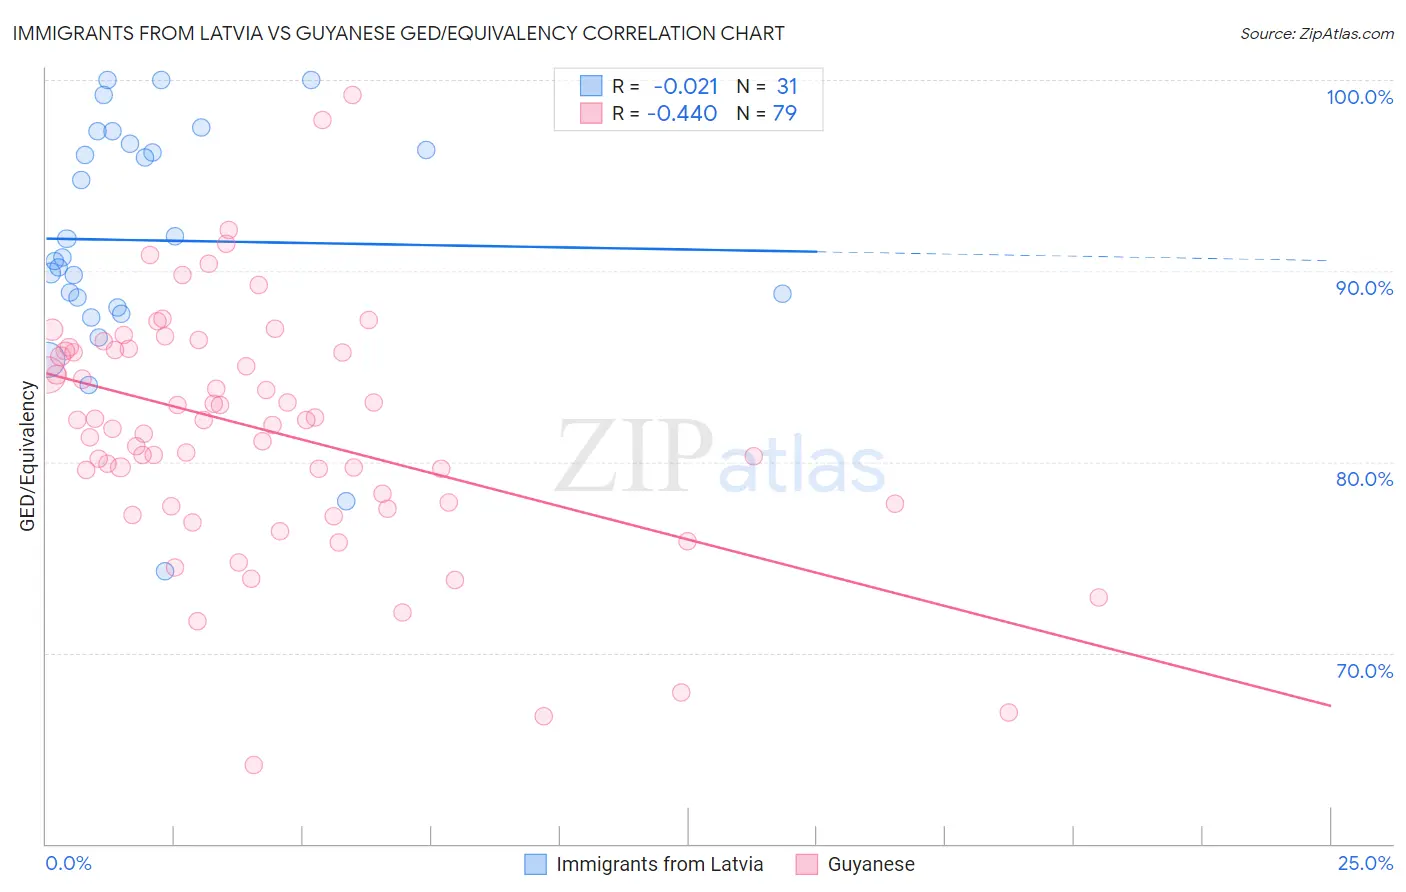
Immigrants from Latvia vs Guyanese GED/Equivalency Correlation Chart
The statistical analysis conducted on geographies consisting of 113,735,345 people shows no correlation between the proportion of Immigrants from Latvia and percentage of population with at least ged/equivalency education in the United States with a correlation coefficient (R) of -0.021 and weighted average of 88.1%. Similarly, the statistical analysis conducted on geographies consisting of 176,940,942 people shows a moderate negative correlation between the proportion of Guyanese and percentage of population with at least ged/equivalency education in the United States with a correlation coefficient (R) of -0.440 and weighted average of 81.3%, a difference of 8.4%.
GED/Equivalency Correlation Summary
| Measurement | Immigrants from Latvia | Guyanese |
| Minimum | 74.3% | 64.1% |
| Maximum | 100.0% | 99.2% |
| Range | 25.7% | 35.1% |
| Mean | 91.6% | 81.7% |
| Median | 90.7% | 82.2% |
| Interquartile 25% (IQ1) | 88.1% | 77.8% |
| Interquartile 75% (IQ3) | 96.7% | 85.9% |
| Interquartile Range (IQR) | 8.5% | 8.1% |
| Standard Deviation (Sample) | 6.3% | 6.4% |
| Standard Deviation (Population) | 6.2% | 6.3% |
Similar Demographics by GED/Equivalency
Demographics Similar to Immigrants from Latvia by GED/Equivalency
In terms of ged/equivalency, the demographic groups most similar to Immigrants from Latvia are Immigrants from Switzerland (88.1%, a difference of 0.010%), Greek (88.1%, a difference of 0.010%), Australian (88.1%, a difference of 0.020%), Czech (88.1%, a difference of 0.030%), and Immigrants from Korea (88.1%, a difference of 0.030%).
| Demographics | Rating | Rank | GED/Equivalency |
| Italians | 99.6 /100 | #40 | Exceptional 88.2% |
| Finns | 99.6 /100 | #41 | Exceptional 88.2% |
| Cambodians | 99.6 /100 | #42 | Exceptional 88.2% |
| Immigrants | Scotland | 99.6 /100 | #43 | Exceptional 88.2% |
| Macedonians | 99.5 /100 | #44 | Exceptional 88.1% |
| Czechs | 99.5 /100 | #45 | Exceptional 88.1% |
| Immigrants | Switzerland | 99.5 /100 | #46 | Exceptional 88.1% |
| Immigrants | Latvia | 99.5 /100 | #47 | Exceptional 88.1% |
| Greeks | 99.5 /100 | #48 | Exceptional 88.1% |
| Australians | 99.5 /100 | #49 | Exceptional 88.1% |
| Immigrants | Korea | 99.5 /100 | #50 | Exceptional 88.1% |
| Immigrants | Netherlands | 99.4 /100 | #51 | Exceptional 88.0% |
| Zimbabweans | 99.4 /100 | #52 | Exceptional 88.0% |
| Immigrants | South Africa | 99.4 /100 | #53 | Exceptional 88.0% |
| Soviet Union | 99.4 /100 | #54 | Exceptional 88.0% |
Demographics Similar to Guyanese by GED/Equivalency
In terms of ged/equivalency, the demographic groups most similar to Guyanese are Immigrants from Grenada (81.3%, a difference of 0.020%), Immigrants from Dominica (81.1%, a difference of 0.17%), Navajo (81.5%, a difference of 0.23%), Puerto Rican (81.1%, a difference of 0.28%), and Immigrants from Haiti (81.6%, a difference of 0.33%).
| Demographics | Rating | Rank | GED/Equivalency |
| Ecuadorians | 0.0 /100 | #299 | Tragic 81.7% |
| Fijians | 0.0 /100 | #300 | Tragic 81.6% |
| Dutch West Indians | 0.0 /100 | #301 | Tragic 81.6% |
| Immigrants | Haiti | 0.0 /100 | #302 | Tragic 81.6% |
| Immigrants | Portugal | 0.0 /100 | #303 | Tragic 81.6% |
| Navajo | 0.0 /100 | #304 | Tragic 81.5% |
| Immigrants | Grenada | 0.0 /100 | #305 | Tragic 81.3% |
| Guyanese | 0.0 /100 | #306 | Tragic 81.3% |
| Immigrants | Dominica | 0.0 /100 | #307 | Tragic 81.1% |
| Puerto Ricans | 0.0 /100 | #308 | Tragic 81.1% |
| Immigrants | Ecuador | 0.0 /100 | #309 | Tragic 81.0% |
| Immigrants | Guyana | 0.0 /100 | #310 | Tragic 81.0% |
| Natives/Alaskans | 0.0 /100 | #311 | Tragic 80.9% |
| Nicaraguans | 0.0 /100 | #312 | Tragic 80.9% |
| Cape Verdeans | 0.0 /100 | #313 | Tragic 80.9% |