Immigrants from Latvia vs Danish GED/Equivalency
COMPARE
Immigrants from Latvia
Danish
GED/Equivalency
GED/Equivalency Comparison
Immigrants from Latvia
Danes
88.1%
GED/EQUIVALENCY
99.5/ 100
METRIC RATING
47th/ 347
METRIC RANK
88.4%
GED/EQUIVALENCY
99.8/ 100
METRIC RATING
32nd/ 347
METRIC RANK
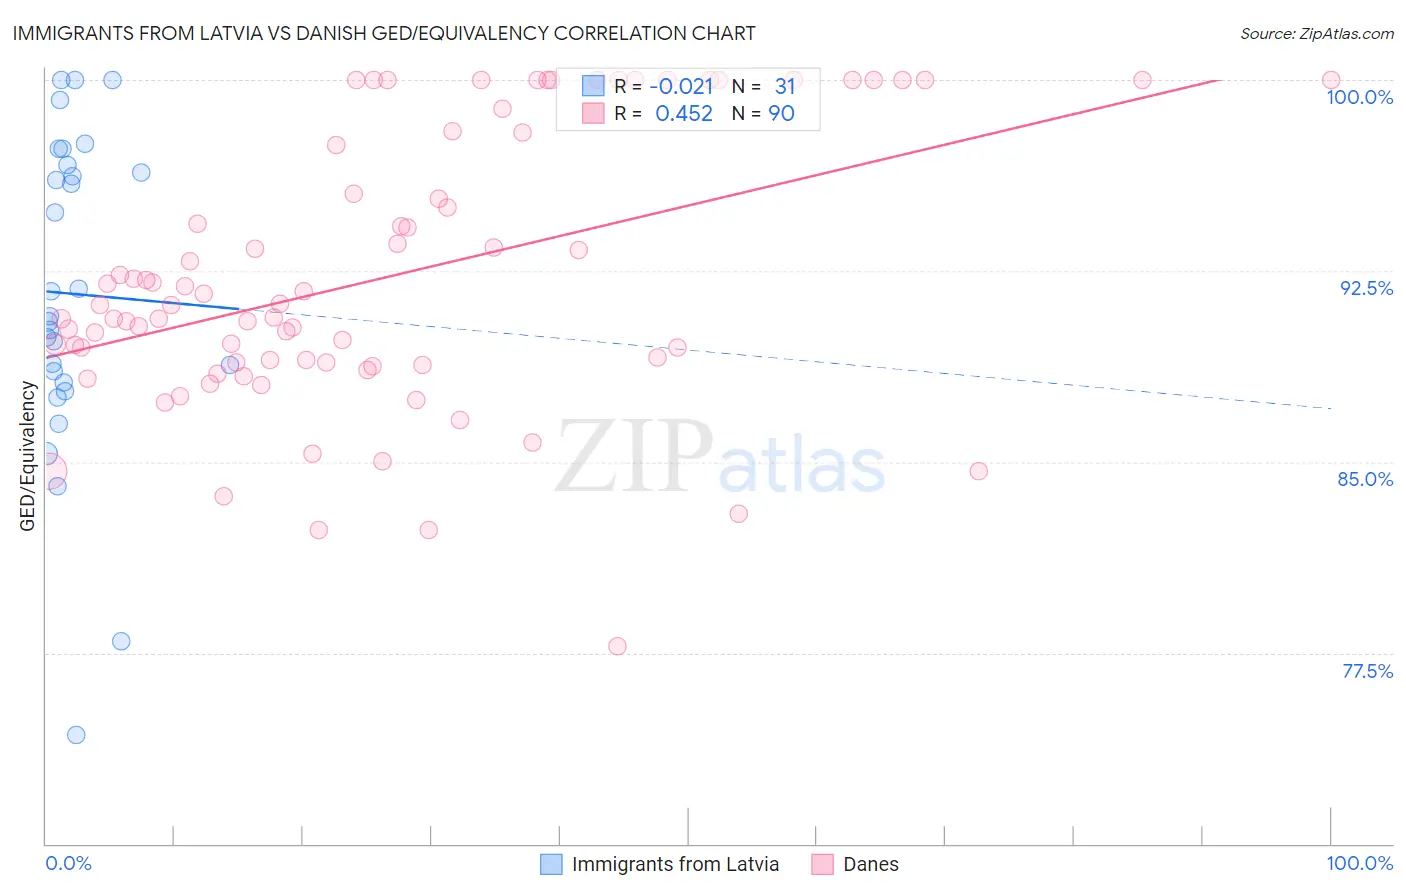
Immigrants from Latvia vs Danish GED/Equivalency Correlation Chart
The statistical analysis conducted on geographies consisting of 113,735,345 people shows no correlation between the proportion of Immigrants from Latvia and percentage of population with at least ged/equivalency education in the United States with a correlation coefficient (R) of -0.021 and weighted average of 88.1%. Similarly, the statistical analysis conducted on geographies consisting of 474,193,540 people shows a moderate positive correlation between the proportion of Danes and percentage of population with at least ged/equivalency education in the United States with a correlation coefficient (R) of 0.452 and weighted average of 88.4%, a difference of 0.40%.
GED/Equivalency Correlation Summary
| Measurement | Immigrants from Latvia | Danish |
| Minimum | 74.3% | 77.8% |
| Maximum | 100.0% | 100.0% |
| Range | 25.7% | 22.2% |
| Mean | 91.6% | 92.3% |
| Median | 90.7% | 91.2% |
| Interquartile 25% (IQ1) | 88.1% | 88.9% |
| Interquartile 75% (IQ3) | 96.7% | 97.9% |
| Interquartile Range (IQR) | 8.5% | 9.0% |
| Standard Deviation (Sample) | 6.3% | 5.4% |
| Standard Deviation (Population) | 6.2% | 5.3% |
Demographics Similar to Immigrants from Latvia and Danes by GED/Equivalency
In terms of ged/equivalency, the demographic groups most similar to Immigrants from Latvia are Immigrants from Switzerland (88.1%, a difference of 0.010%), Greek (88.1%, a difference of 0.010%), Australian (88.1%, a difference of 0.020%), Czech (88.1%, a difference of 0.030%), and Macedonian (88.1%, a difference of 0.060%). Similarly, the demographic groups most similar to Danes are Bhutanese (88.4%, a difference of 0.020%), Immigrants from Sweden (88.4%, a difference of 0.040%), Turkish (88.5%, a difference of 0.050%), Immigrants from Japan (88.4%, a difference of 0.050%), and Immigrants from South Central Asia (88.4%, a difference of 0.060%).
| Demographics | Rating | Rank | GED/Equivalency |
| Poles | 99.8 /100 | #29 | Exceptional 88.5% |
| Turks | 99.8 /100 | #30 | Exceptional 88.5% |
| Bhutanese | 99.8 /100 | #31 | Exceptional 88.4% |
| Danes | 99.8 /100 | #32 | Exceptional 88.4% |
| Immigrants | Sweden | 99.7 /100 | #33 | Exceptional 88.4% |
| Immigrants | Japan | 99.7 /100 | #34 | Exceptional 88.4% |
| Immigrants | South Central Asia | 99.7 /100 | #35 | Exceptional 88.4% |
| Immigrants | Belgium | 99.7 /100 | #36 | Exceptional 88.3% |
| Immigrants | Austria | 99.7 /100 | #37 | Exceptional 88.3% |
| Burmese | 99.7 /100 | #38 | Exceptional 88.3% |
| Immigrants | Israel | 99.6 /100 | #39 | Exceptional 88.2% |
| Italians | 99.6 /100 | #40 | Exceptional 88.2% |
| Finns | 99.6 /100 | #41 | Exceptional 88.2% |
| Cambodians | 99.6 /100 | #42 | Exceptional 88.2% |
| Immigrants | Scotland | 99.6 /100 | #43 | Exceptional 88.2% |
| Macedonians | 99.5 /100 | #44 | Exceptional 88.1% |
| Czechs | 99.5 /100 | #45 | Exceptional 88.1% |
| Immigrants | Switzerland | 99.5 /100 | #46 | Exceptional 88.1% |
| Immigrants | Latvia | 99.5 /100 | #47 | Exceptional 88.1% |
| Greeks | 99.5 /100 | #48 | Exceptional 88.1% |
| Australians | 99.5 /100 | #49 | Exceptional 88.1% |