Immigrants from Latvia vs Romanian GED/Equivalency
COMPARE
Immigrants from Latvia
Romanian
GED/Equivalency
GED/Equivalency Comparison
Immigrants from Latvia
Romanians
88.1%
GED/EQUIVALENCY
99.5/ 100
METRIC RATING
47th/ 347
METRIC RANK
87.5%
GED/EQUIVALENCY
98.3/ 100
METRIC RATING
82nd/ 347
METRIC RANK
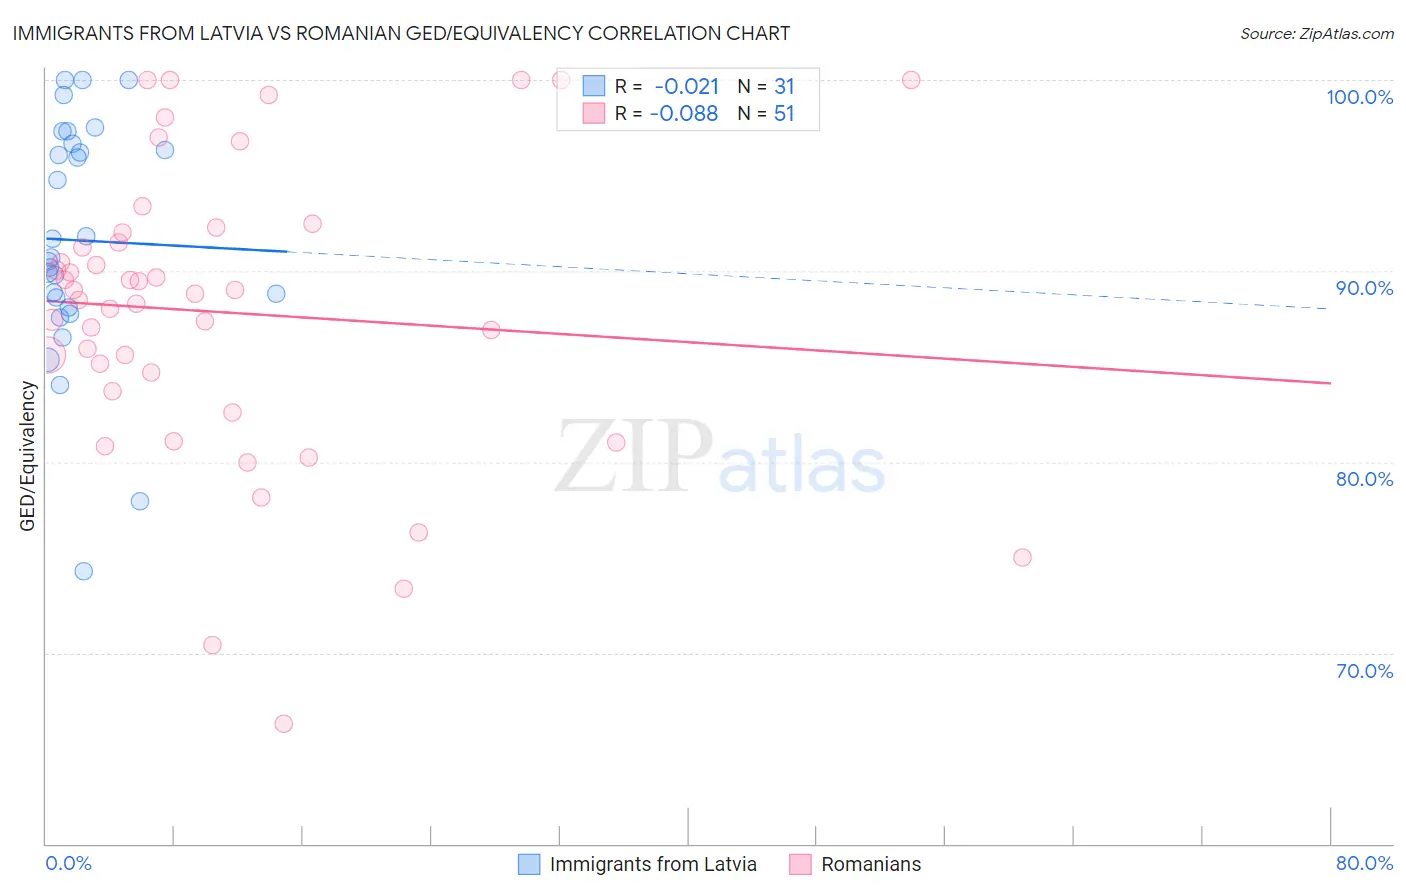
Immigrants from Latvia vs Romanian GED/Equivalency Correlation Chart
The statistical analysis conducted on geographies consisting of 113,735,345 people shows no correlation between the proportion of Immigrants from Latvia and percentage of population with at least ged/equivalency education in the United States with a correlation coefficient (R) of -0.021 and weighted average of 88.1%. Similarly, the statistical analysis conducted on geographies consisting of 377,905,400 people shows a slight negative correlation between the proportion of Romanians and percentage of population with at least ged/equivalency education in the United States with a correlation coefficient (R) of -0.088 and weighted average of 87.5%, a difference of 0.61%.
GED/Equivalency Correlation Summary
| Measurement | Immigrants from Latvia | Romanian |
| Minimum | 74.3% | 66.3% |
| Maximum | 100.0% | 100.0% |
| Range | 25.7% | 33.7% |
| Mean | 91.6% | 87.8% |
| Median | 90.7% | 88.8% |
| Interquartile 25% (IQ1) | 88.1% | 83.7% |
| Interquartile 75% (IQ3) | 96.7% | 92.0% |
| Interquartile Range (IQR) | 8.5% | 8.3% |
| Standard Deviation (Sample) | 6.3% | 7.7% |
| Standard Deviation (Population) | 6.2% | 7.7% |
Similar Demographics by GED/Equivalency
Demographics Similar to Immigrants from Latvia by GED/Equivalency
In terms of ged/equivalency, the demographic groups most similar to Immigrants from Latvia are Immigrants from Switzerland (88.1%, a difference of 0.010%), Greek (88.1%, a difference of 0.010%), Australian (88.1%, a difference of 0.020%), Czech (88.1%, a difference of 0.030%), and Immigrants from Korea (88.1%, a difference of 0.030%).
| Demographics | Rating | Rank | GED/Equivalency |
| Italians | 99.6 /100 | #40 | Exceptional 88.2% |
| Finns | 99.6 /100 | #41 | Exceptional 88.2% |
| Cambodians | 99.6 /100 | #42 | Exceptional 88.2% |
| Immigrants | Scotland | 99.6 /100 | #43 | Exceptional 88.2% |
| Macedonians | 99.5 /100 | #44 | Exceptional 88.1% |
| Czechs | 99.5 /100 | #45 | Exceptional 88.1% |
| Immigrants | Switzerland | 99.5 /100 | #46 | Exceptional 88.1% |
| Immigrants | Latvia | 99.5 /100 | #47 | Exceptional 88.1% |
| Greeks | 99.5 /100 | #48 | Exceptional 88.1% |
| Australians | 99.5 /100 | #49 | Exceptional 88.1% |
| Immigrants | Korea | 99.5 /100 | #50 | Exceptional 88.1% |
| Immigrants | Netherlands | 99.4 /100 | #51 | Exceptional 88.0% |
| Zimbabweans | 99.4 /100 | #52 | Exceptional 88.0% |
| Immigrants | South Africa | 99.4 /100 | #53 | Exceptional 88.0% |
| Soviet Union | 99.4 /100 | #54 | Exceptional 88.0% |
Demographics Similar to Romanians by GED/Equivalency
In terms of ged/equivalency, the demographic groups most similar to Romanians are Immigrants from Sri Lanka (87.5%, a difference of 0.010%), South African (87.5%, a difference of 0.010%), Immigrants from England (87.6%, a difference of 0.050%), Immigrants from Romania (87.5%, a difference of 0.050%), and Dutch (87.5%, a difference of 0.050%).
| Demographics | Rating | Rank | GED/Equivalency |
| Scottish | 98.7 /100 | #75 | Exceptional 87.7% |
| Immigrants | Serbia | 98.7 /100 | #76 | Exceptional 87.7% |
| Slavs | 98.7 /100 | #77 | Exceptional 87.7% |
| Irish | 98.6 /100 | #78 | Exceptional 87.6% |
| English | 98.6 /100 | #79 | Exceptional 87.6% |
| Immigrants | England | 98.5 /100 | #80 | Exceptional 87.6% |
| Immigrants | Sri Lanka | 98.3 /100 | #81 | Exceptional 87.5% |
| Romanians | 98.3 /100 | #82 | Exceptional 87.5% |
| South Africans | 98.3 /100 | #83 | Exceptional 87.5% |
| Immigrants | Romania | 98.1 /100 | #84 | Exceptional 87.5% |
| Dutch | 98.1 /100 | #85 | Exceptional 87.5% |
| Immigrants | Europe | 98.1 /100 | #86 | Exceptional 87.5% |
| Native Hawaiians | 98.1 /100 | #87 | Exceptional 87.5% |
| Immigrants | Norway | 98.1 /100 | #88 | Exceptional 87.5% |
| Hungarians | 97.9 /100 | #89 | Exceptional 87.4% |