Immigrants from Latvia vs Blackfeet GED/Equivalency
COMPARE
Immigrants from Latvia
Blackfeet
GED/Equivalency
GED/Equivalency Comparison
Immigrants from Latvia
Blackfeet
88.1%
GED/EQUIVALENCY
99.5/ 100
METRIC RATING
47th/ 347
METRIC RANK
83.8%
GED/EQUIVALENCY
1.1/ 100
METRIC RATING
248th/ 347
METRIC RANK
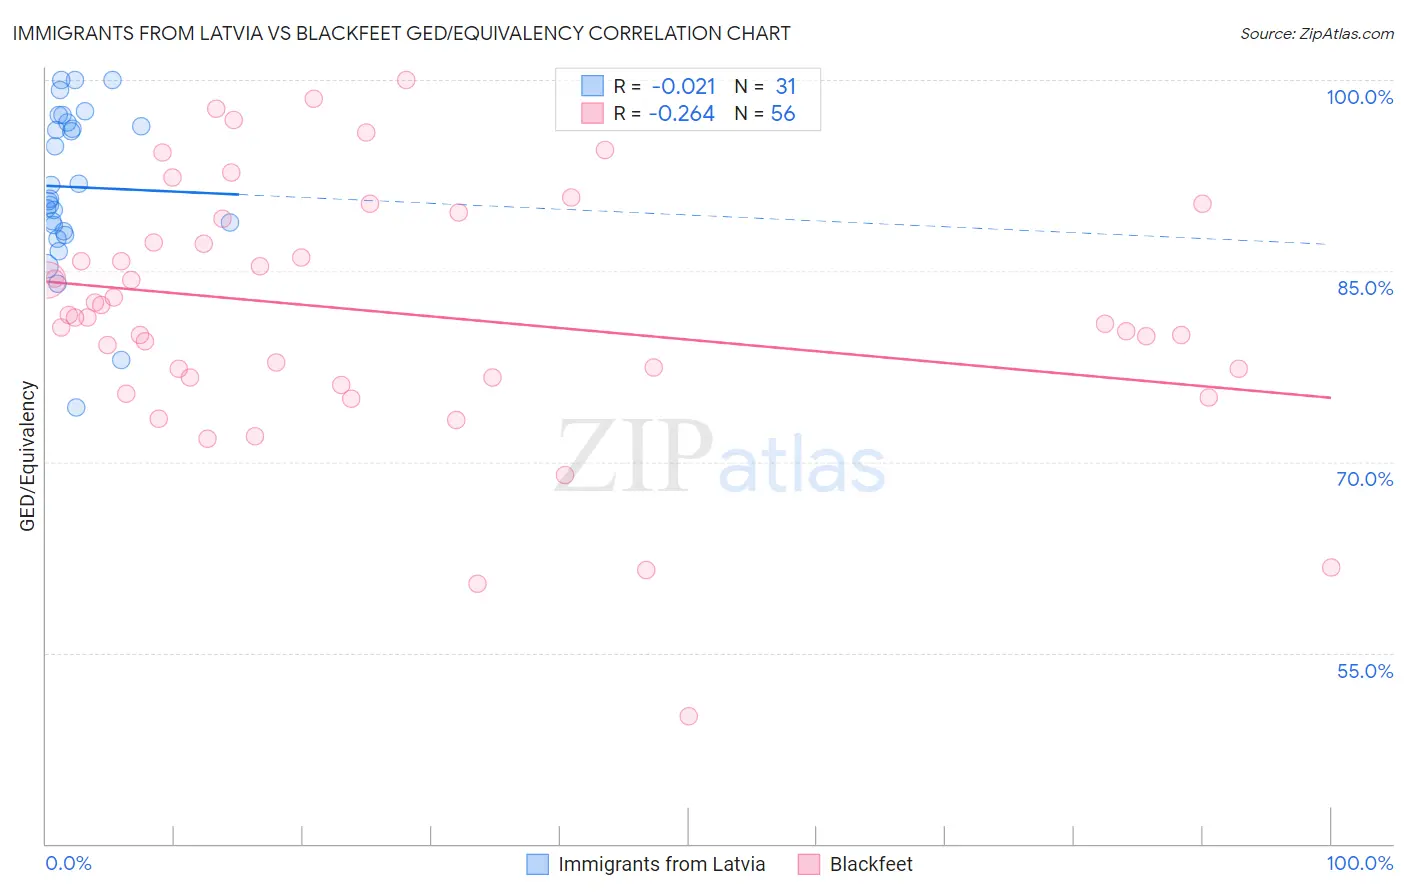
Immigrants from Latvia vs Blackfeet GED/Equivalency Correlation Chart
The statistical analysis conducted on geographies consisting of 113,735,345 people shows no correlation between the proportion of Immigrants from Latvia and percentage of population with at least ged/equivalency education in the United States with a correlation coefficient (R) of -0.021 and weighted average of 88.1%. Similarly, the statistical analysis conducted on geographies consisting of 309,582,068 people shows a weak negative correlation between the proportion of Blackfeet and percentage of population with at least ged/equivalency education in the United States with a correlation coefficient (R) of -0.264 and weighted average of 83.8%, a difference of 5.1%.
GED/Equivalency Correlation Summary
| Measurement | Immigrants from Latvia | Blackfeet |
| Minimum | 74.3% | 50.0% |
| Maximum | 100.0% | 100.0% |
| Range | 25.7% | 50.0% |
| Mean | 91.6% | 81.7% |
| Median | 90.7% | 81.4% |
| Interquartile 25% (IQ1) | 88.1% | 76.6% |
| Interquartile 75% (IQ3) | 96.7% | 88.2% |
| Interquartile Range (IQR) | 8.5% | 11.6% |
| Standard Deviation (Sample) | 6.3% | 9.9% |
| Standard Deviation (Population) | 6.2% | 9.8% |
Similar Demographics by GED/Equivalency
Demographics Similar to Immigrants from Latvia by GED/Equivalency
In terms of ged/equivalency, the demographic groups most similar to Immigrants from Latvia are Immigrants from Switzerland (88.1%, a difference of 0.010%), Greek (88.1%, a difference of 0.010%), Australian (88.1%, a difference of 0.020%), Czech (88.1%, a difference of 0.030%), and Immigrants from Korea (88.1%, a difference of 0.030%).
| Demographics | Rating | Rank | GED/Equivalency |
| Italians | 99.6 /100 | #40 | Exceptional 88.2% |
| Finns | 99.6 /100 | #41 | Exceptional 88.2% |
| Cambodians | 99.6 /100 | #42 | Exceptional 88.2% |
| Immigrants | Scotland | 99.6 /100 | #43 | Exceptional 88.2% |
| Macedonians | 99.5 /100 | #44 | Exceptional 88.1% |
| Czechs | 99.5 /100 | #45 | Exceptional 88.1% |
| Immigrants | Switzerland | 99.5 /100 | #46 | Exceptional 88.1% |
| Immigrants | Latvia | 99.5 /100 | #47 | Exceptional 88.1% |
| Greeks | 99.5 /100 | #48 | Exceptional 88.1% |
| Australians | 99.5 /100 | #49 | Exceptional 88.1% |
| Immigrants | Korea | 99.5 /100 | #50 | Exceptional 88.1% |
| Immigrants | Netherlands | 99.4 /100 | #51 | Exceptional 88.0% |
| Zimbabweans | 99.4 /100 | #52 | Exceptional 88.0% |
| Immigrants | South Africa | 99.4 /100 | #53 | Exceptional 88.0% |
| Soviet Union | 99.4 /100 | #54 | Exceptional 88.0% |
Demographics Similar to Blackfeet by GED/Equivalency
In terms of ged/equivalency, the demographic groups most similar to Blackfeet are Crow (83.8%, a difference of 0.010%), Immigrants from Western Africa (83.8%, a difference of 0.020%), Shoshone (83.7%, a difference of 0.020%), Chickasaw (83.8%, a difference of 0.050%), and Immigrants from Senegal (83.8%, a difference of 0.070%).
| Demographics | Rating | Rank | GED/Equivalency |
| Senegalese | 1.9 /100 | #241 | Tragic 84.0% |
| Sri Lankans | 1.9 /100 | #242 | Tragic 84.0% |
| Cherokee | 1.3 /100 | #243 | Tragic 83.9% |
| Immigrants | Ghana | 1.3 /100 | #244 | Tragic 83.9% |
| Immigrants | Senegal | 1.2 /100 | #245 | Tragic 83.8% |
| Chickasaw | 1.2 /100 | #246 | Tragic 83.8% |
| Immigrants | Western Africa | 1.1 /100 | #247 | Tragic 83.8% |
| Blackfeet | 1.1 /100 | #248 | Tragic 83.8% |
| Crow | 1.1 /100 | #249 | Tragic 83.8% |
| Shoshone | 1.0 /100 | #250 | Tragic 83.7% |
| Spanish Americans | 0.8 /100 | #251 | Tragic 83.6% |
| Bahamians | 0.8 /100 | #252 | Tragic 83.6% |
| Comanche | 0.7 /100 | #253 | Tragic 83.6% |
| Creek | 0.7 /100 | #254 | Tragic 83.6% |
| Colville | 0.5 /100 | #255 | Tragic 83.4% |