Immigrants from Latvia vs Guyanese Unemployment
COMPARE
Immigrants from Latvia
Guyanese
Unemployment
Unemployment Comparison
Immigrants from Latvia
Guyanese
5.1%
UNEMPLOYMENT
88.0/ 100
METRIC RATING
129th/ 347
METRIC RANK
6.9%
UNEMPLOYMENT
0.0/ 100
METRIC RATING
322nd/ 347
METRIC RANK
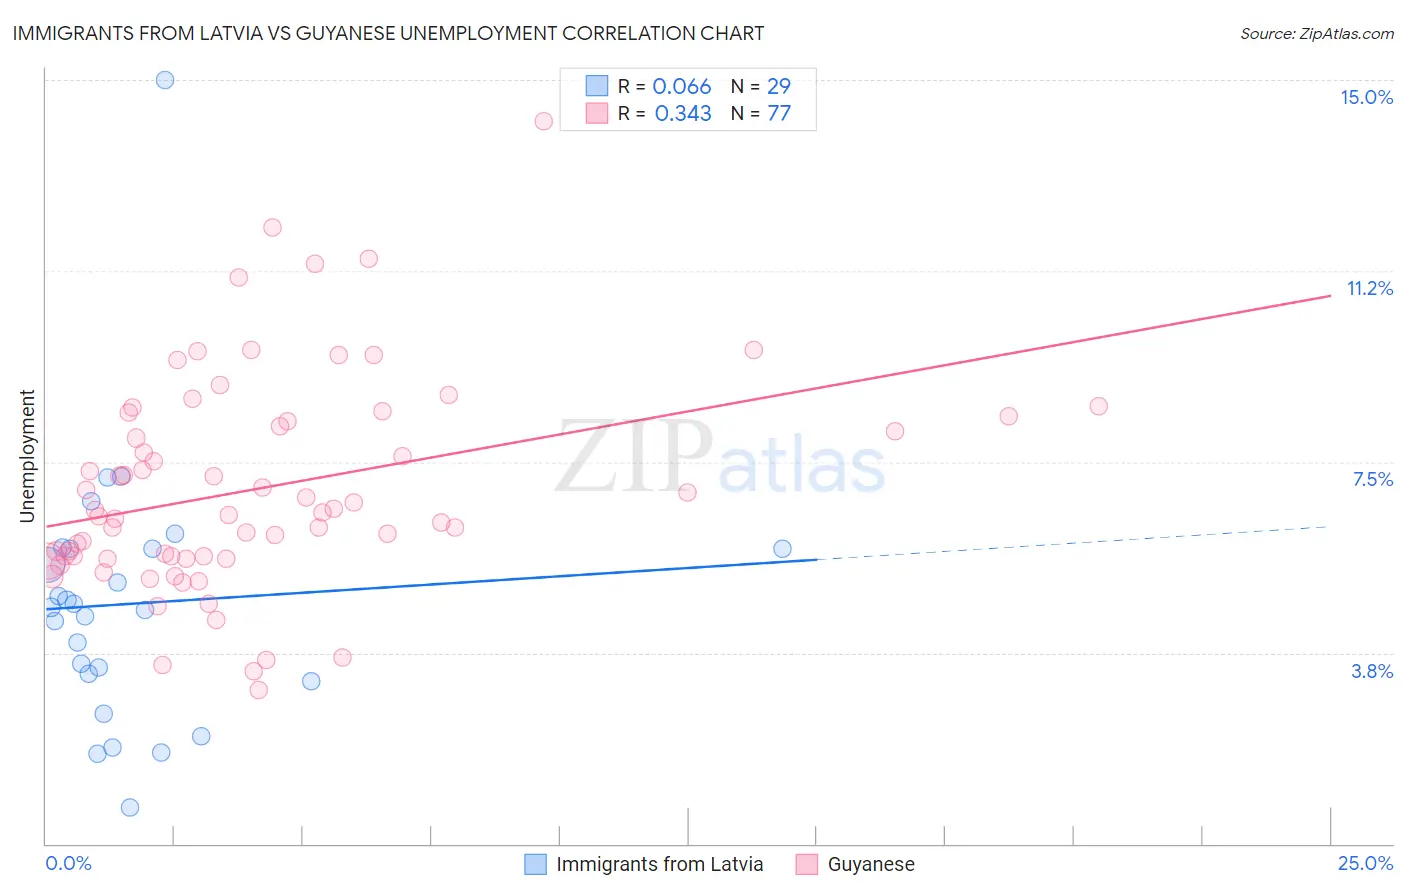
Immigrants from Latvia vs Guyanese Unemployment Correlation Chart
The statistical analysis conducted on geographies consisting of 113,721,061 people shows a slight positive correlation between the proportion of Immigrants from Latvia and unemployment in the United States with a correlation coefficient (R) of 0.066 and weighted average of 5.1%. Similarly, the statistical analysis conducted on geographies consisting of 176,860,990 people shows a mild positive correlation between the proportion of Guyanese and unemployment in the United States with a correlation coefficient (R) of 0.343 and weighted average of 6.9%, a difference of 35.2%.
Unemployment Correlation Summary
| Measurement | Immigrants from Latvia | Guyanese |
| Minimum | 0.70% | 3.0% |
| Maximum | 15.0% | 14.2% |
| Range | 14.3% | 11.2% |
| Mean | 4.7% | 7.0% |
| Median | 4.6% | 6.5% |
| Interquartile 25% (IQ1) | 3.3% | 5.6% |
| Interquartile 75% (IQ3) | 5.8% | 8.3% |
| Interquartile Range (IQR) | 2.5% | 2.7% |
| Standard Deviation (Sample) | 2.6% | 2.1% |
| Standard Deviation (Population) | 2.6% | 2.1% |
Similar Demographics by Unemployment
Demographics Similar to Immigrants from Latvia by Unemployment
In terms of unemployment, the demographic groups most similar to Immigrants from Latvia are Immigrants from Eastern Africa (5.1%, a difference of 0.0%), Kenyan (5.1%, a difference of 0.020%), Immigrants from Kenya (5.1%, a difference of 0.020%), Immigrants from Eastern Asia (5.1%, a difference of 0.040%), and Ethiopian (5.1%, a difference of 0.090%).
| Demographics | Rating | Rank | Unemployment |
| Immigrants | Switzerland | 89.1 /100 | #122 | Excellent 5.1% |
| Asians | 89.0 /100 | #123 | Excellent 5.1% |
| Ethiopians | 88.6 /100 | #124 | Excellent 5.1% |
| Immigrants | Eastern Asia | 88.3 /100 | #125 | Excellent 5.1% |
| Kenyans | 88.2 /100 | #126 | Excellent 5.1% |
| Immigrants | Kenya | 88.2 /100 | #127 | Excellent 5.1% |
| Immigrants | Eastern Africa | 88.1 /100 | #128 | Excellent 5.1% |
| Immigrants | Latvia | 88.0 /100 | #129 | Excellent 5.1% |
| Iranians | 86.9 /100 | #130 | Excellent 5.1% |
| Immigrants | Croatia | 86.8 /100 | #131 | Excellent 5.1% |
| Immigrants | Ethiopia | 86.7 /100 | #132 | Excellent 5.1% |
| Immigrants | Jordan | 86.6 /100 | #133 | Excellent 5.1% |
| Immigrants | Europe | 86.3 /100 | #134 | Excellent 5.1% |
| Immigrants | Burma/Myanmar | 86.2 /100 | #135 | Excellent 5.1% |
| Immigrants | Spain | 86.2 /100 | #136 | Excellent 5.1% |
Demographics Similar to Guyanese by Unemployment
In terms of unemployment, the demographic groups most similar to Guyanese are Immigrants from Guyana (6.9%, a difference of 0.040%), Immigrants from St. Vincent and the Grenadines (6.9%, a difference of 0.050%), Immigrants from Grenada (6.9%, a difference of 0.32%), British West Indian (6.8%, a difference of 0.85%), and Immigrants from Cabo Verde (6.8%, a difference of 1.1%).
| Demographics | Rating | Rank | Unemployment |
| Houma | 0.0 /100 | #315 | Tragic 6.7% |
| Immigrants | Dominica | 0.0 /100 | #316 | Tragic 6.7% |
| Shoshone | 0.0 /100 | #317 | Tragic 6.8% |
| Immigrants | Cabo Verde | 0.0 /100 | #318 | Tragic 6.8% |
| British West Indians | 0.0 /100 | #319 | Tragic 6.8% |
| Immigrants | St. Vincent and the Grenadines | 0.0 /100 | #320 | Tragic 6.9% |
| Immigrants | Guyana | 0.0 /100 | #321 | Tragic 6.9% |
| Guyanese | 0.0 /100 | #322 | Tragic 6.9% |
| Immigrants | Grenada | 0.0 /100 | #323 | Tragic 6.9% |
| Immigrants | Armenia | 0.0 /100 | #324 | Tragic 7.0% |
| Natives/Alaskans | 0.0 /100 | #325 | Tragic 7.0% |
| Paiute | 0.0 /100 | #326 | Tragic 7.1% |
| Pueblo | 0.0 /100 | #327 | Tragic 7.2% |
| Tsimshian | 0.0 /100 | #328 | Tragic 7.2% |
| Alaska Natives | 0.0 /100 | #329 | Tragic 7.2% |