Immigrants from Latvia vs Danish Family Households with Children
COMPARE
Immigrants from Latvia
Danish
Family Households with Children
Family Households with Children Comparison
Immigrants from Latvia
Danes
25.9%
FAMILY HOUSEHOLDS WITH CHILDREN
0.0/ 100
METRIC RATING
330th/ 347
METRIC RANK
28.7%
FAMILY HOUSEHOLDS WITH CHILDREN
100.0/ 100
METRIC RATING
57th/ 347
METRIC RANK
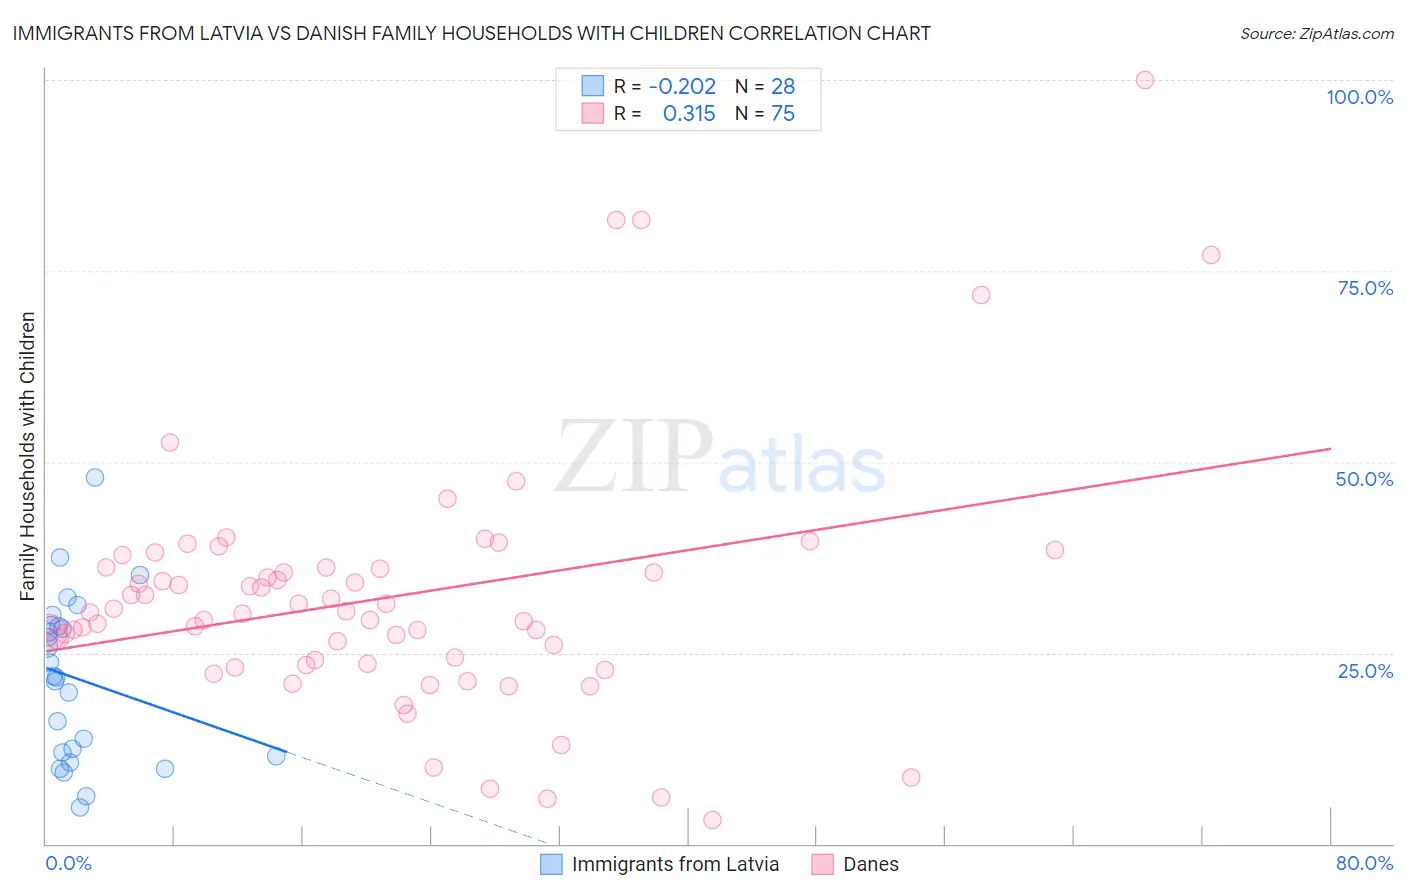
Immigrants from Latvia vs Danish Family Households with Children Correlation Chart
The statistical analysis conducted on geographies consisting of 113,723,252 people shows a weak negative correlation between the proportion of Immigrants from Latvia and percentage of family households with children in the United States with a correlation coefficient (R) of -0.202 and weighted average of 25.9%. Similarly, the statistical analysis conducted on geographies consisting of 473,642,797 people shows a mild positive correlation between the proportion of Danes and percentage of family households with children in the United States with a correlation coefficient (R) of 0.315 and weighted average of 28.7%, a difference of 11.2%.
Family Households with Children Correlation Summary
| Measurement | Immigrants from Latvia | Danish |
| Minimum | 4.7% | 3.0% |
| Maximum | 48.0% | 100.0% |
| Range | 43.3% | 97.0% |
| Mean | 21.6% | 32.3% |
| Median | 21.9% | 30.2% |
| Interquartile 25% (IQ1) | 11.7% | 23.6% |
| Interquartile 75% (IQ3) | 28.6% | 36.1% |
| Interquartile Range (IQR) | 16.9% | 12.5% |
| Standard Deviation (Sample) | 10.7% | 16.7% |
| Standard Deviation (Population) | 10.5% | 16.6% |
Similar Demographics by Family Households with Children
Demographics Similar to Immigrants from Latvia by Family Households with Children
In terms of family households with children, the demographic groups most similar to Immigrants from Latvia are Slovene (25.8%, a difference of 0.13%), Cypriot (25.9%, a difference of 0.18%), Immigrants from Albania (25.9%, a difference of 0.31%), Immigrants from Austria (25.8%, a difference of 0.36%), and Immigrants from Barbados (26.0%, a difference of 0.41%).
| Demographics | Rating | Rank | Family Households with Children |
| Immigrants | Australia | 0.0 /100 | #323 | Tragic 26.0% |
| Chinese | 0.0 /100 | #324 | Tragic 26.0% |
| Barbadians | 0.0 /100 | #325 | Tragic 26.0% |
| Immigrants | Ireland | 0.0 /100 | #326 | Tragic 26.0% |
| Immigrants | Barbados | 0.0 /100 | #327 | Tragic 26.0% |
| Immigrants | Albania | 0.0 /100 | #328 | Tragic 25.9% |
| Cypriots | 0.0 /100 | #329 | Tragic 25.9% |
| Immigrants | Latvia | 0.0 /100 | #330 | Tragic 25.9% |
| Slovenes | 0.0 /100 | #331 | Tragic 25.8% |
| Immigrants | Austria | 0.0 /100 | #332 | Tragic 25.8% |
| Immigrants | Switzerland | 0.0 /100 | #333 | Tragic 25.7% |
| Slovaks | 0.0 /100 | #334 | Tragic 25.7% |
| Immigrants | Croatia | 0.0 /100 | #335 | Tragic 25.7% |
| Immigrants | West Indies | 0.0 /100 | #336 | Tragic 25.7% |
| Puerto Ricans | 0.0 /100 | #337 | Tragic 25.6% |
Demographics Similar to Danes by Family Households with Children
In terms of family households with children, the demographic groups most similar to Danes are Hawaiian (28.7%, a difference of 0.15%), Immigrants from Guatemala (28.8%, a difference of 0.24%), Immigrants from Asia (28.8%, a difference of 0.31%), Sierra Leonean (28.9%, a difference of 0.38%), and Immigrants from Cambodia (28.9%, a difference of 0.45%).
| Demographics | Rating | Rank | Family Households with Children |
| Immigrants | Immigrants | 100.0 /100 | #50 | Exceptional 28.9% |
| Immigrants | Peru | 100.0 /100 | #51 | Exceptional 28.9% |
| Guatemalans | 100.0 /100 | #52 | Exceptional 28.9% |
| Immigrants | Cambodia | 100.0 /100 | #53 | Exceptional 28.9% |
| Sierra Leoneans | 100.0 /100 | #54 | Exceptional 28.9% |
| Immigrants | Asia | 100.0 /100 | #55 | Exceptional 28.8% |
| Immigrants | Guatemala | 100.0 /100 | #56 | Exceptional 28.8% |
| Danes | 100.0 /100 | #57 | Exceptional 28.7% |
| Hawaiians | 100.0 /100 | #58 | Exceptional 28.7% |
| Immigrants | Nigeria | 100.0 /100 | #59 | Exceptional 28.6% |
| Hmong | 99.9 /100 | #60 | Exceptional 28.6% |
| Immigrants | Ghana | 99.9 /100 | #61 | Exceptional 28.6% |
| Egyptians | 99.9 /100 | #62 | Exceptional 28.6% |
| Immigrants | Lebanon | 99.9 /100 | #63 | Exceptional 28.6% |
| Filipinos | 99.9 /100 | #64 | Exceptional 28.6% |