Native/Alaskan vs Immigrants from Burma/Myanmar College, Under 1 year
COMPARE
Native/Alaskan
Immigrants from Burma/Myanmar
College, Under 1 year
College, Under 1 year Comparison
Natives/Alaskans
Immigrants from Burma/Myanmar
56.6%
COLLEGE, UNDER 1 YEAR
0.0/ 100
METRIC RATING
321st/ 347
METRIC RANK
62.5%
COLLEGE, UNDER 1 YEAR
1.6/ 100
METRIC RATING
237th/ 347
METRIC RANK
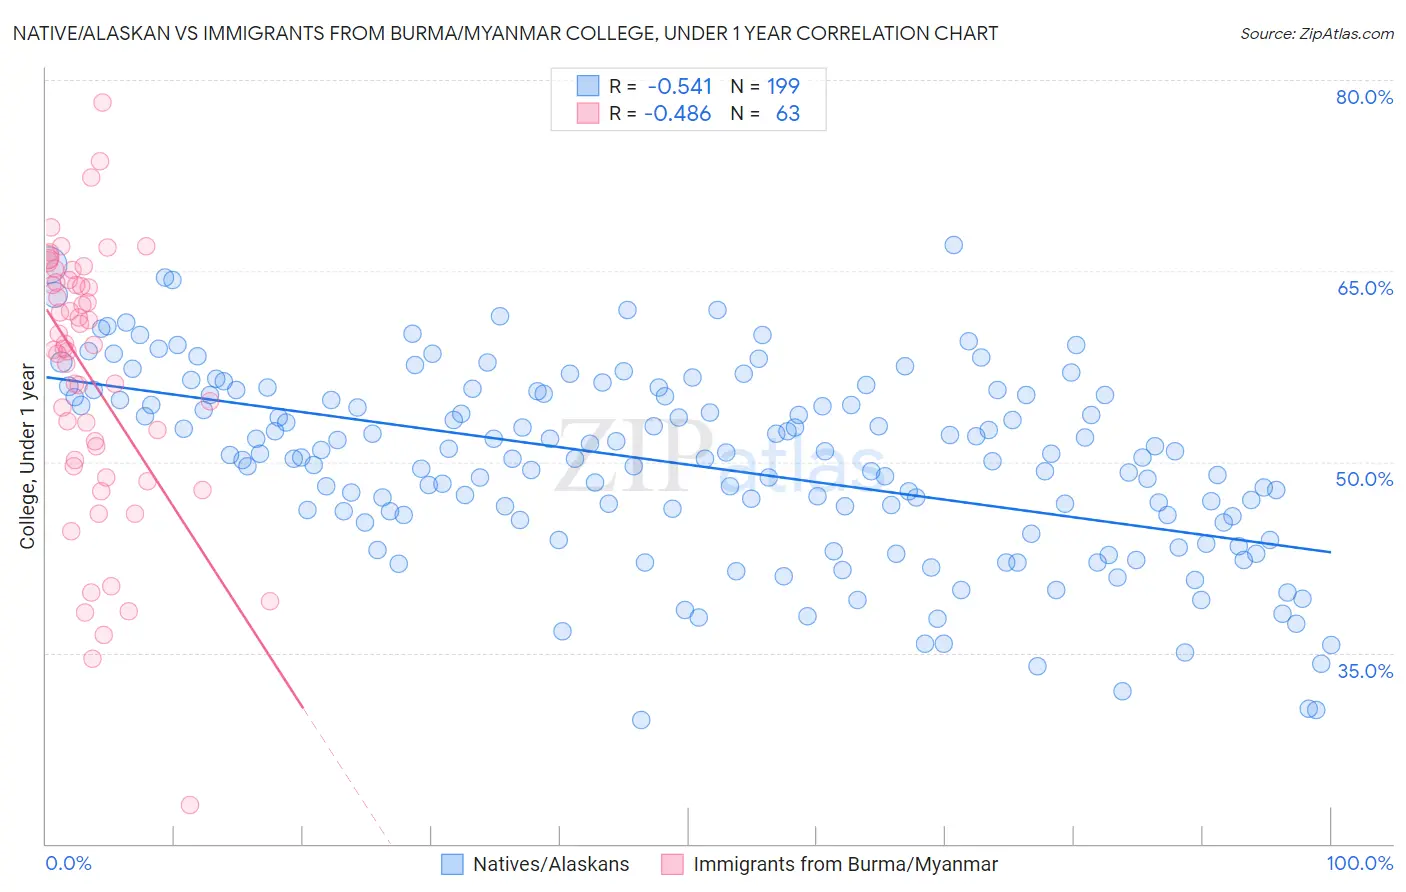
Native/Alaskan vs Immigrants from Burma/Myanmar College, Under 1 year Correlation Chart
The statistical analysis conducted on geographies consisting of 513,071,269 people shows a substantial negative correlation between the proportion of Natives/Alaskans and percentage of population with at least college, under 1 year education in the United States with a correlation coefficient (R) of -0.541 and weighted average of 56.6%. Similarly, the statistical analysis conducted on geographies consisting of 172,357,324 people shows a moderate negative correlation between the proportion of Immigrants from Burma/Myanmar and percentage of population with at least college, under 1 year education in the United States with a correlation coefficient (R) of -0.486 and weighted average of 62.5%, a difference of 10.3%.
College, Under 1 year Correlation Summary
| Measurement | Native/Alaskan | Immigrants from Burma/Myanmar |
| Minimum | 29.7% | 23.1% |
| Maximum | 67.0% | 78.3% |
| Range | 37.4% | 55.2% |
| Mean | 49.8% | 56.5% |
| Median | 50.4% | 58.9% |
| Interquartile 25% (IQ1) | 45.4% | 49.7% |
| Interquartile 75% (IQ3) | 55.2% | 64.1% |
| Interquartile Range (IQR) | 9.8% | 14.4% |
| Standard Deviation (Sample) | 7.4% | 10.7% |
| Standard Deviation (Population) | 7.4% | 10.6% |
Similar Demographics by College, Under 1 year
Demographics Similar to Natives/Alaskans by College, Under 1 year
In terms of college, under 1 year, the demographic groups most similar to Natives/Alaskans are Immigrants from Caribbean (56.6%, a difference of 0.13%), Guatemalan (56.8%, a difference of 0.26%), Immigrants from Honduras (56.5%, a difference of 0.31%), Puerto Rican (56.8%, a difference of 0.32%), and Immigrants from El Salvador (56.4%, a difference of 0.44%).
| Demographics | Rating | Rank | College, Under 1 year |
| Hopi | 0.0 /100 | #314 | Tragic 57.1% |
| Hondurans | 0.0 /100 | #315 | Tragic 57.1% |
| Menominee | 0.0 /100 | #316 | Tragic 57.0% |
| Hispanics or Latinos | 0.0 /100 | #317 | Tragic 57.0% |
| Immigrants | Haiti | 0.0 /100 | #318 | Tragic 56.9% |
| Puerto Ricans | 0.0 /100 | #319 | Tragic 56.8% |
| Guatemalans | 0.0 /100 | #320 | Tragic 56.8% |
| Natives/Alaskans | 0.0 /100 | #321 | Tragic 56.6% |
| Immigrants | Caribbean | 0.0 /100 | #322 | Tragic 56.6% |
| Immigrants | Honduras | 0.0 /100 | #323 | Tragic 56.5% |
| Immigrants | El Salvador | 0.0 /100 | #324 | Tragic 56.4% |
| Immigrants | Latin America | 0.0 /100 | #325 | Tragic 56.3% |
| Navajo | 0.0 /100 | #326 | Tragic 56.3% |
| Immigrants | Guatemala | 0.0 /100 | #327 | Tragic 56.2% |
| Cape Verdeans | 0.0 /100 | #328 | Tragic 56.0% |
Demographics Similar to Immigrants from Burma/Myanmar by College, Under 1 year
In terms of college, under 1 year, the demographic groups most similar to Immigrants from Burma/Myanmar are Immigrants (62.5%, a difference of 0.030%), French American Indian (62.4%, a difference of 0.090%), Spanish American (62.6%, a difference of 0.16%), Chippewa (62.6%, a difference of 0.21%), and Iroquois (62.6%, a difference of 0.24%).
| Demographics | Rating | Rank | College, Under 1 year |
| Immigrants | Nonimmigrants | 3.0 /100 | #230 | Tragic 62.9% |
| Immigrants | Western Africa | 2.4 /100 | #231 | Tragic 62.8% |
| Osage | 2.2 /100 | #232 | Tragic 62.7% |
| Iroquois | 2.0 /100 | #233 | Tragic 62.6% |
| Chippewa | 2.0 /100 | #234 | Tragic 62.6% |
| Spanish Americans | 1.9 /100 | #235 | Tragic 62.6% |
| Immigrants | Immigrants | 1.7 /100 | #236 | Tragic 62.5% |
| Immigrants | Burma/Myanmar | 1.6 /100 | #237 | Tragic 62.5% |
| French American Indians | 1.5 /100 | #238 | Tragic 62.4% |
| Nepalese | 1.1 /100 | #239 | Tragic 62.2% |
| Aleuts | 1.1 /100 | #240 | Tragic 62.2% |
| Ottawa | 1.1 /100 | #241 | Tragic 62.2% |
| Malaysians | 1.1 /100 | #242 | Tragic 62.2% |
| Hawaiians | 1.1 /100 | #243 | Tragic 62.1% |
| Colville | 1.0 /100 | #244 | Tragic 62.1% |