Yugoslavian vs Immigrants from Burma/Myanmar College, Under 1 year
COMPARE
Yugoslavian
Immigrants from Burma/Myanmar
College, Under 1 year
College, Under 1 year Comparison
Yugoslavians
Immigrants from Burma/Myanmar
65.6%
COLLEGE, UNDER 1 YEAR
55.7/ 100
METRIC RATING
169th/ 347
METRIC RANK
62.5%
COLLEGE, UNDER 1 YEAR
1.6/ 100
METRIC RATING
237th/ 347
METRIC RANK
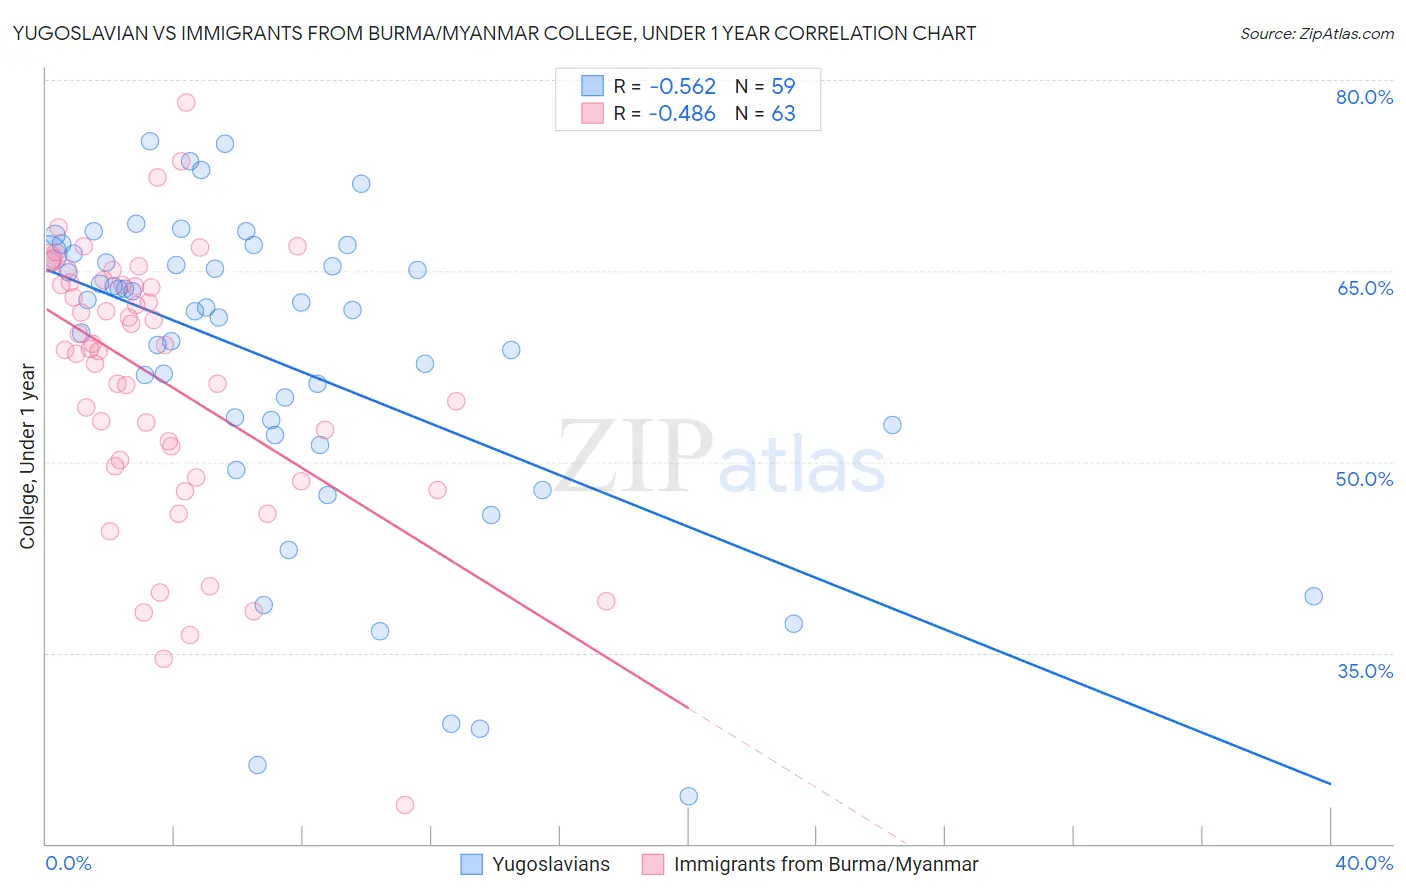
Yugoslavian vs Immigrants from Burma/Myanmar College, Under 1 year Correlation Chart
The statistical analysis conducted on geographies consisting of 285,723,201 people shows a substantial negative correlation between the proportion of Yugoslavians and percentage of population with at least college, under 1 year education in the United States with a correlation coefficient (R) of -0.562 and weighted average of 65.6%. Similarly, the statistical analysis conducted on geographies consisting of 172,357,324 people shows a moderate negative correlation between the proportion of Immigrants from Burma/Myanmar and percentage of population with at least college, under 1 year education in the United States with a correlation coefficient (R) of -0.486 and weighted average of 62.5%, a difference of 5.0%.
College, Under 1 year Correlation Summary
| Measurement | Yugoslavian | Immigrants from Burma/Myanmar |
| Minimum | 23.8% | 23.1% |
| Maximum | 75.2% | 78.3% |
| Range | 51.5% | 55.2% |
| Mean | 57.7% | 56.5% |
| Median | 61.9% | 58.9% |
| Interquartile 25% (IQ1) | 52.1% | 49.7% |
| Interquartile 75% (IQ3) | 66.3% | 64.1% |
| Interquartile Range (IQR) | 14.2% | 14.4% |
| Standard Deviation (Sample) | 12.5% | 10.7% |
| Standard Deviation (Population) | 12.3% | 10.6% |
Similar Demographics by College, Under 1 year
Demographics Similar to Yugoslavians by College, Under 1 year
In terms of college, under 1 year, the demographic groups most similar to Yugoslavians are German (65.6%, a difference of 0.0%), Hungarian (65.6%, a difference of 0.010%), Immigrants from Somalia (65.6%, a difference of 0.030%), Immigrants from Oceania (65.6%, a difference of 0.030%), and Moroccan (65.6%, a difference of 0.040%).
| Demographics | Rating | Rank | College, Under 1 year |
| Koreans | 65.3 /100 | #162 | Good 65.9% |
| Somalis | 62.7 /100 | #163 | Good 65.8% |
| Czechoslovakians | 62.6 /100 | #164 | Good 65.8% |
| Immigrants | Uzbekistan | 61.6 /100 | #165 | Good 65.8% |
| Moroccans | 56.7 /100 | #166 | Average 65.6% |
| Immigrants | Somalia | 56.4 /100 | #167 | Average 65.6% |
| Hungarians | 55.9 /100 | #168 | Average 65.6% |
| Yugoslavians | 55.7 /100 | #169 | Average 65.6% |
| Germans | 55.7 /100 | #170 | Average 65.6% |
| Immigrants | Oceania | 55.0 /100 | #171 | Average 65.6% |
| South American Indians | 54.4 /100 | #172 | Average 65.5% |
| Swiss | 53.9 /100 | #173 | Average 65.5% |
| Immigrants | Bosnia and Herzegovina | 50.0 /100 | #174 | Average 65.4% |
| Scotch-Irish | 49.5 /100 | #175 | Average 65.4% |
| French | 48.9 /100 | #176 | Average 65.4% |
Demographics Similar to Immigrants from Burma/Myanmar by College, Under 1 year
In terms of college, under 1 year, the demographic groups most similar to Immigrants from Burma/Myanmar are Immigrants (62.5%, a difference of 0.030%), French American Indian (62.4%, a difference of 0.090%), Spanish American (62.6%, a difference of 0.16%), Chippewa (62.6%, a difference of 0.21%), and Iroquois (62.6%, a difference of 0.24%).
| Demographics | Rating | Rank | College, Under 1 year |
| Immigrants | Nonimmigrants | 3.0 /100 | #230 | Tragic 62.9% |
| Immigrants | Western Africa | 2.4 /100 | #231 | Tragic 62.8% |
| Osage | 2.2 /100 | #232 | Tragic 62.7% |
| Iroquois | 2.0 /100 | #233 | Tragic 62.6% |
| Chippewa | 2.0 /100 | #234 | Tragic 62.6% |
| Spanish Americans | 1.9 /100 | #235 | Tragic 62.6% |
| Immigrants | Immigrants | 1.7 /100 | #236 | Tragic 62.5% |
| Immigrants | Burma/Myanmar | 1.6 /100 | #237 | Tragic 62.5% |
| French American Indians | 1.5 /100 | #238 | Tragic 62.4% |
| Nepalese | 1.1 /100 | #239 | Tragic 62.2% |
| Aleuts | 1.1 /100 | #240 | Tragic 62.2% |
| Ottawa | 1.1 /100 | #241 | Tragic 62.2% |
| Malaysians | 1.1 /100 | #242 | Tragic 62.2% |
| Hawaiians | 1.1 /100 | #243 | Tragic 62.1% |
| Colville | 1.0 /100 | #244 | Tragic 62.1% |