Immigrants from Korea vs Palestinian Doctorate Degree
COMPARE
Immigrants from Korea
Palestinian
Doctorate Degree
Doctorate Degree Comparison
Immigrants from Korea
Palestinians
2.6%
DOCTORATE DEGREE
100.0/ 100
METRIC RATING
30th/ 347
METRIC RANK
2.0%
DOCTORATE DEGREE
92.0/ 100
METRIC RATING
127th/ 347
METRIC RANK
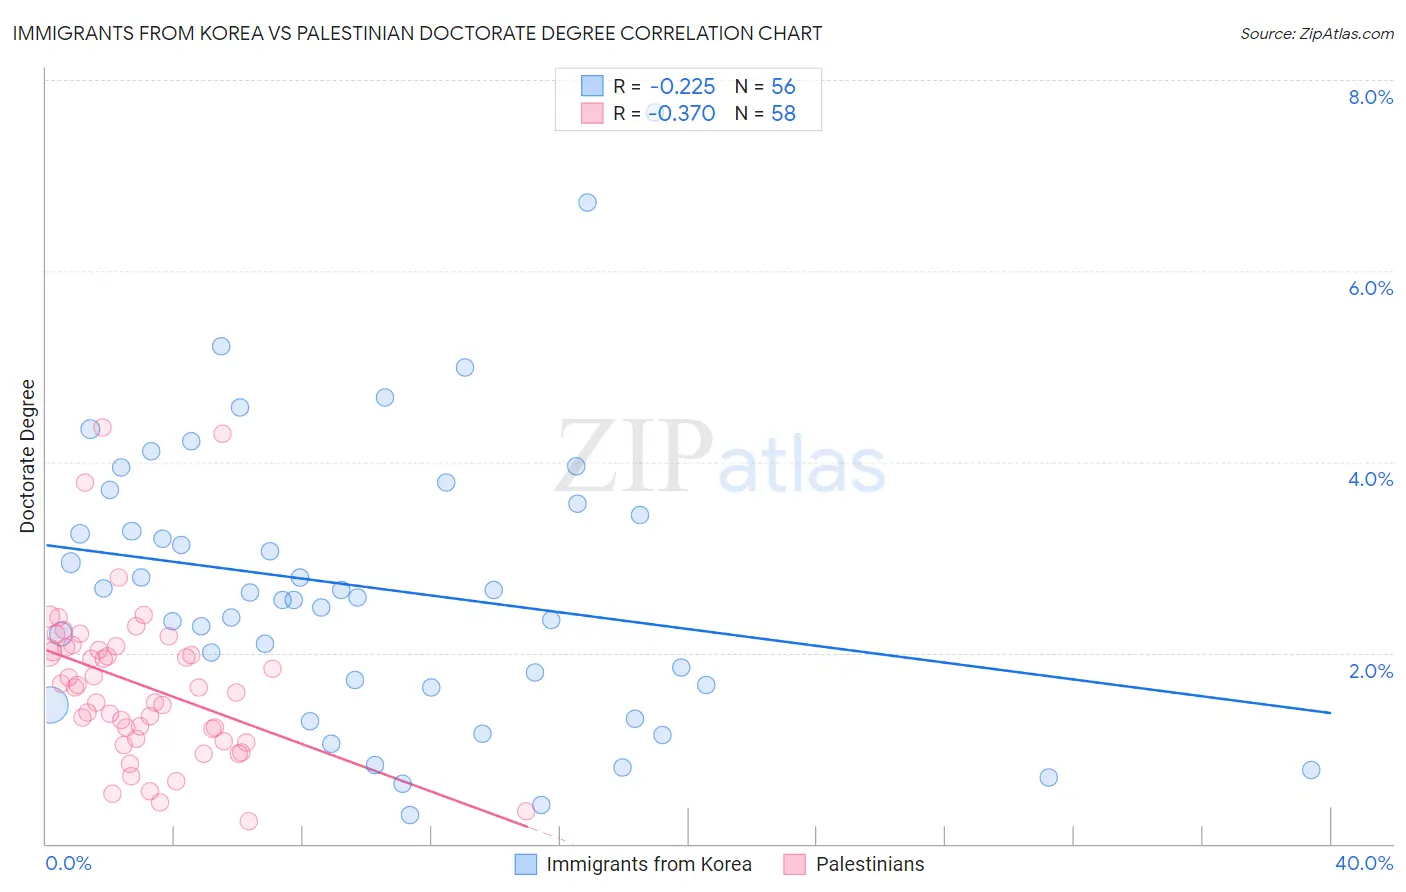
Immigrants from Korea vs Palestinian Doctorate Degree Correlation Chart
The statistical analysis conducted on geographies consisting of 412,960,054 people shows a weak negative correlation between the proportion of Immigrants from Korea and percentage of population with at least doctorate degree education in the United States with a correlation coefficient (R) of -0.225 and weighted average of 2.6%. Similarly, the statistical analysis conducted on geographies consisting of 215,891,149 people shows a mild negative correlation between the proportion of Palestinians and percentage of population with at least doctorate degree education in the United States with a correlation coefficient (R) of -0.370 and weighted average of 2.0%, a difference of 31.1%.
Doctorate Degree Correlation Summary
| Measurement | Immigrants from Korea | Palestinian |
| Minimum | 0.30% | 0.24% |
| Maximum | 7.7% | 4.4% |
| Range | 7.3% | 4.1% |
| Mean | 2.7% | 1.7% |
| Median | 2.6% | 1.6% |
| Interquartile 25% (IQ1) | 1.7% | 1.1% |
| Interquartile 75% (IQ3) | 3.5% | 2.1% |
| Interquartile Range (IQR) | 1.8% | 0.95% |
| Standard Deviation (Sample) | 1.5% | 0.83% |
| Standard Deviation (Population) | 1.5% | 0.82% |
Similar Demographics by Doctorate Degree
Demographics Similar to Immigrants from Korea by Doctorate Degree
In terms of doctorate degree, the demographic groups most similar to Immigrants from Korea are Immigrants from South Central Asia (2.6%, a difference of 0.040%), Burmese (2.6%, a difference of 0.30%), Immigrants from Turkey (2.6%, a difference of 0.61%), Turkish (2.7%, a difference of 1.5%), and Latvian (2.6%, a difference of 2.0%).
| Demographics | Rating | Rank | Doctorate Degree |
| Immigrants | Denmark | 100.0 /100 | #23 | Exceptional 2.8% |
| Israelis | 100.0 /100 | #24 | Exceptional 2.7% |
| Immigrants | Saudi Arabia | 100.0 /100 | #25 | Exceptional 2.7% |
| Turks | 100.0 /100 | #26 | Exceptional 2.7% |
| Immigrants | Turkey | 100.0 /100 | #27 | Exceptional 2.6% |
| Burmese | 100.0 /100 | #28 | Exceptional 2.6% |
| Immigrants | South Central Asia | 100.0 /100 | #29 | Exceptional 2.6% |
| Immigrants | Korea | 100.0 /100 | #30 | Exceptional 2.6% |
| Latvians | 100.0 /100 | #31 | Exceptional 2.6% |
| Immigrants | Northern Europe | 100.0 /100 | #32 | Exceptional 2.6% |
| Cambodians | 100.0 /100 | #33 | Exceptional 2.6% |
| Cypriots | 100.0 /100 | #34 | Exceptional 2.6% |
| Immigrants | Malaysia | 100.0 /100 | #35 | Exceptional 2.6% |
| Immigrants | Spain | 100.0 /100 | #36 | Exceptional 2.6% |
| Immigrants | Kuwait | 100.0 /100 | #37 | Exceptional 2.6% |
Demographics Similar to Palestinians by Doctorate Degree
In terms of doctorate degree, the demographic groups most similar to Palestinians are Jordanian (2.0%, a difference of 0.040%), Immigrants from Zaire (2.0%, a difference of 0.42%), Moroccan (2.0%, a difference of 0.45%), Ute (2.0%, a difference of 0.56%), and Canadian (2.0%, a difference of 0.63%).
| Demographics | Rating | Rank | Doctorate Degree |
| Immigrants | Morocco | 95.5 /100 | #120 | Exceptional 2.0% |
| Immigrants | Jordan | 94.8 /100 | #121 | Exceptional 2.0% |
| Immigrants | Southern Europe | 94.7 /100 | #122 | Exceptional 2.0% |
| Croatians | 94.0 /100 | #123 | Exceptional 2.0% |
| Ute | 93.2 /100 | #124 | Exceptional 2.0% |
| Moroccans | 93.0 /100 | #125 | Exceptional 2.0% |
| Jordanians | 92.1 /100 | #126 | Exceptional 2.0% |
| Palestinians | 92.0 /100 | #127 | Exceptional 2.0% |
| Immigrants | Zaire | 91.1 /100 | #128 | Exceptional 2.0% |
| Canadians | 90.6 /100 | #129 | Exceptional 2.0% |
| Immigrants | Ukraine | 90.5 /100 | #130 | Exceptional 2.0% |
| Immigrants | Sierra Leone | 90.2 /100 | #131 | Exceptional 2.0% |
| Scottish | 89.4 /100 | #132 | Excellent 2.0% |
| Immigrants | Uzbekistan | 89.3 /100 | #133 | Excellent 2.0% |
| Immigrants | Cameroon | 88.9 /100 | #134 | Excellent 2.0% |