Luxembourger vs Palestinian Doctorate Degree
COMPARE
Luxembourger
Palestinian
Doctorate Degree
Doctorate Degree Comparison
Luxembourgers
Palestinians
1.9%
DOCTORATE DEGREE
81.1/ 100
METRIC RATING
148th/ 347
METRIC RANK
2.0%
DOCTORATE DEGREE
92.0/ 100
METRIC RATING
127th/ 347
METRIC RANK
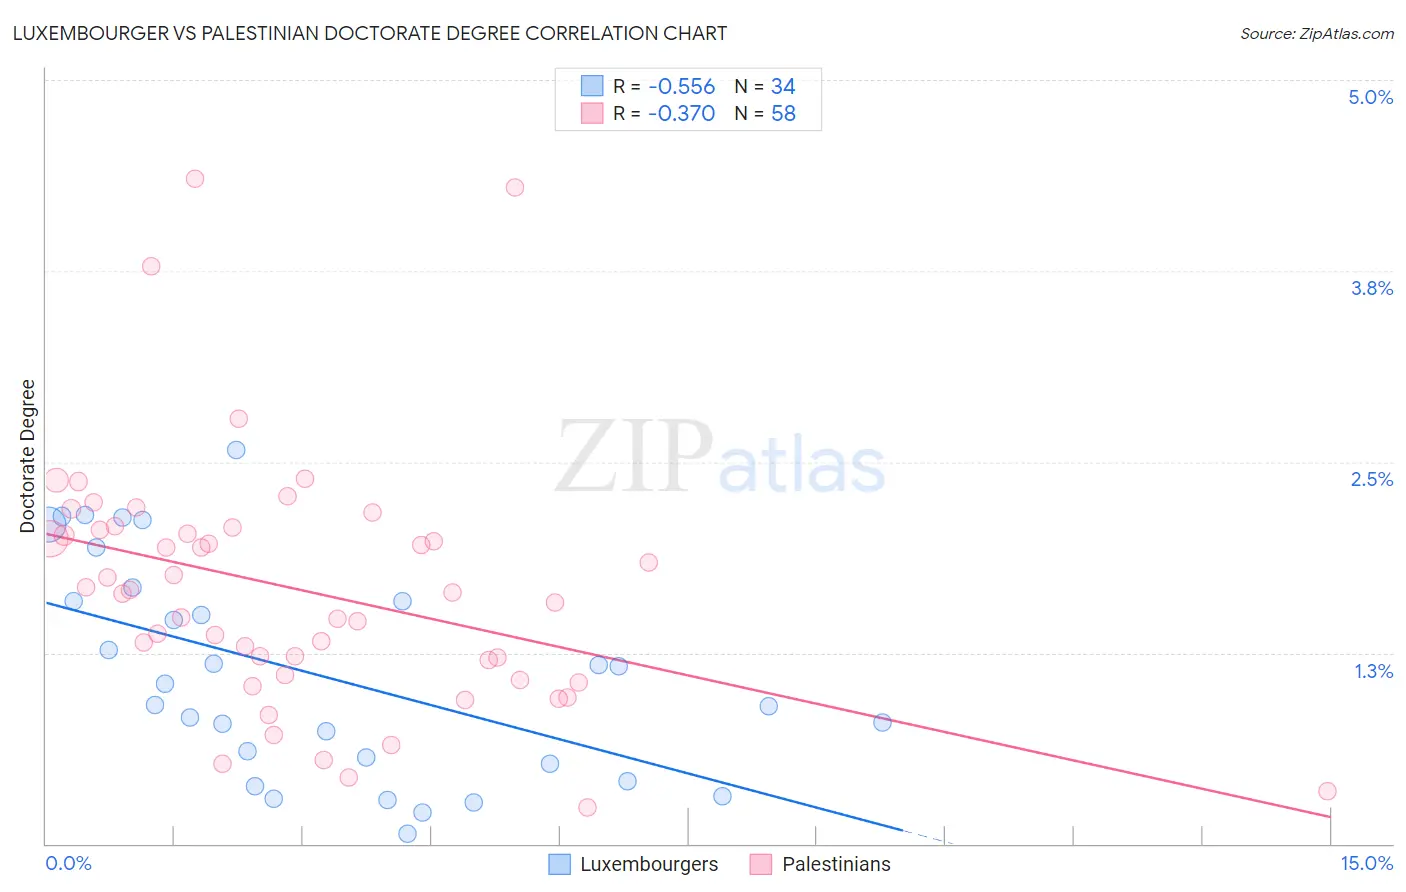
Luxembourger vs Palestinian Doctorate Degree Correlation Chart
The statistical analysis conducted on geographies consisting of 144,093,078 people shows a substantial negative correlation between the proportion of Luxembourgers and percentage of population with at least doctorate degree education in the United States with a correlation coefficient (R) of -0.556 and weighted average of 1.9%. Similarly, the statistical analysis conducted on geographies consisting of 215,891,149 people shows a mild negative correlation between the proportion of Palestinians and percentage of population with at least doctorate degree education in the United States with a correlation coefficient (R) of -0.370 and weighted average of 2.0%, a difference of 3.4%.
Doctorate Degree Correlation Summary
| Measurement | Luxembourger | Palestinian |
| Minimum | 0.063% | 0.24% |
| Maximum | 2.6% | 4.4% |
| Range | 2.5% | 4.1% |
| Mean | 1.1% | 1.7% |
| Median | 0.98% | 1.6% |
| Interquartile 25% (IQ1) | 0.52% | 1.1% |
| Interquartile 75% (IQ3) | 1.6% | 2.1% |
| Interquartile Range (IQR) | 1.1% | 0.95% |
| Standard Deviation (Sample) | 0.70% | 0.83% |
| Standard Deviation (Population) | 0.69% | 0.82% |
Similar Demographics by Doctorate Degree
Demographics Similar to Luxembourgers by Doctorate Degree
In terms of doctorate degree, the demographic groups most similar to Luxembourgers are Immigrants from Senegal (1.9%, a difference of 0.33%), Immigrants from Syria (1.9%, a difference of 0.58%), Kenyan (1.9%, a difference of 0.60%), Immigrants from Moldova (2.0%, a difference of 0.78%), and Basque (1.9%, a difference of 0.90%).
| Demographics | Rating | Rank | Doctorate Degree |
| Senegalese | 86.7 /100 | #141 | Excellent 2.0% |
| Italians | 86.0 /100 | #142 | Excellent 2.0% |
| Sierra Leoneans | 85.1 /100 | #143 | Excellent 2.0% |
| Immigrants | Moldova | 84.3 /100 | #144 | Excellent 2.0% |
| Kenyans | 83.6 /100 | #145 | Excellent 1.9% |
| Immigrants | Syria | 83.6 /100 | #146 | Excellent 1.9% |
| Immigrants | Senegal | 82.5 /100 | #147 | Excellent 1.9% |
| Luxembourgers | 81.1 /100 | #148 | Excellent 1.9% |
| Basques | 76.9 /100 | #149 | Good 1.9% |
| English | 75.9 /100 | #150 | Good 1.9% |
| Albanians | 74.8 /100 | #151 | Good 1.9% |
| Immigrants | Kenya | 74.3 /100 | #152 | Good 1.9% |
| Immigrants | Oceania | 74.0 /100 | #153 | Good 1.9% |
| Immigrants | Albania | 72.8 /100 | #154 | Good 1.9% |
| Poles | 72.7 /100 | #155 | Good 1.9% |
Demographics Similar to Palestinians by Doctorate Degree
In terms of doctorate degree, the demographic groups most similar to Palestinians are Jordanian (2.0%, a difference of 0.040%), Immigrants from Zaire (2.0%, a difference of 0.42%), Moroccan (2.0%, a difference of 0.45%), Ute (2.0%, a difference of 0.56%), and Canadian (2.0%, a difference of 0.63%).
| Demographics | Rating | Rank | Doctorate Degree |
| Immigrants | Morocco | 95.5 /100 | #120 | Exceptional 2.0% |
| Immigrants | Jordan | 94.8 /100 | #121 | Exceptional 2.0% |
| Immigrants | Southern Europe | 94.7 /100 | #122 | Exceptional 2.0% |
| Croatians | 94.0 /100 | #123 | Exceptional 2.0% |
| Ute | 93.2 /100 | #124 | Exceptional 2.0% |
| Moroccans | 93.0 /100 | #125 | Exceptional 2.0% |
| Jordanians | 92.1 /100 | #126 | Exceptional 2.0% |
| Palestinians | 92.0 /100 | #127 | Exceptional 2.0% |
| Immigrants | Zaire | 91.1 /100 | #128 | Exceptional 2.0% |
| Canadians | 90.6 /100 | #129 | Exceptional 2.0% |
| Immigrants | Ukraine | 90.5 /100 | #130 | Exceptional 2.0% |
| Immigrants | Sierra Leone | 90.2 /100 | #131 | Exceptional 2.0% |
| Scottish | 89.4 /100 | #132 | Excellent 2.0% |
| Immigrants | Uzbekistan | 89.3 /100 | #133 | Excellent 2.0% |
| Immigrants | Cameroon | 88.9 /100 | #134 | Excellent 2.0% |