Immigrants from Korea vs Alaska Native Doctorate Degree
COMPARE
Immigrants from Korea
Alaska Native
Doctorate Degree
Doctorate Degree Comparison
Immigrants from Korea
Alaska Natives
2.6%
DOCTORATE DEGREE
100.0/ 100
METRIC RATING
30th/ 347
METRIC RANK
1.4%
DOCTORATE DEGREE
0.3/ 100
METRIC RATING
292nd/ 347
METRIC RANK
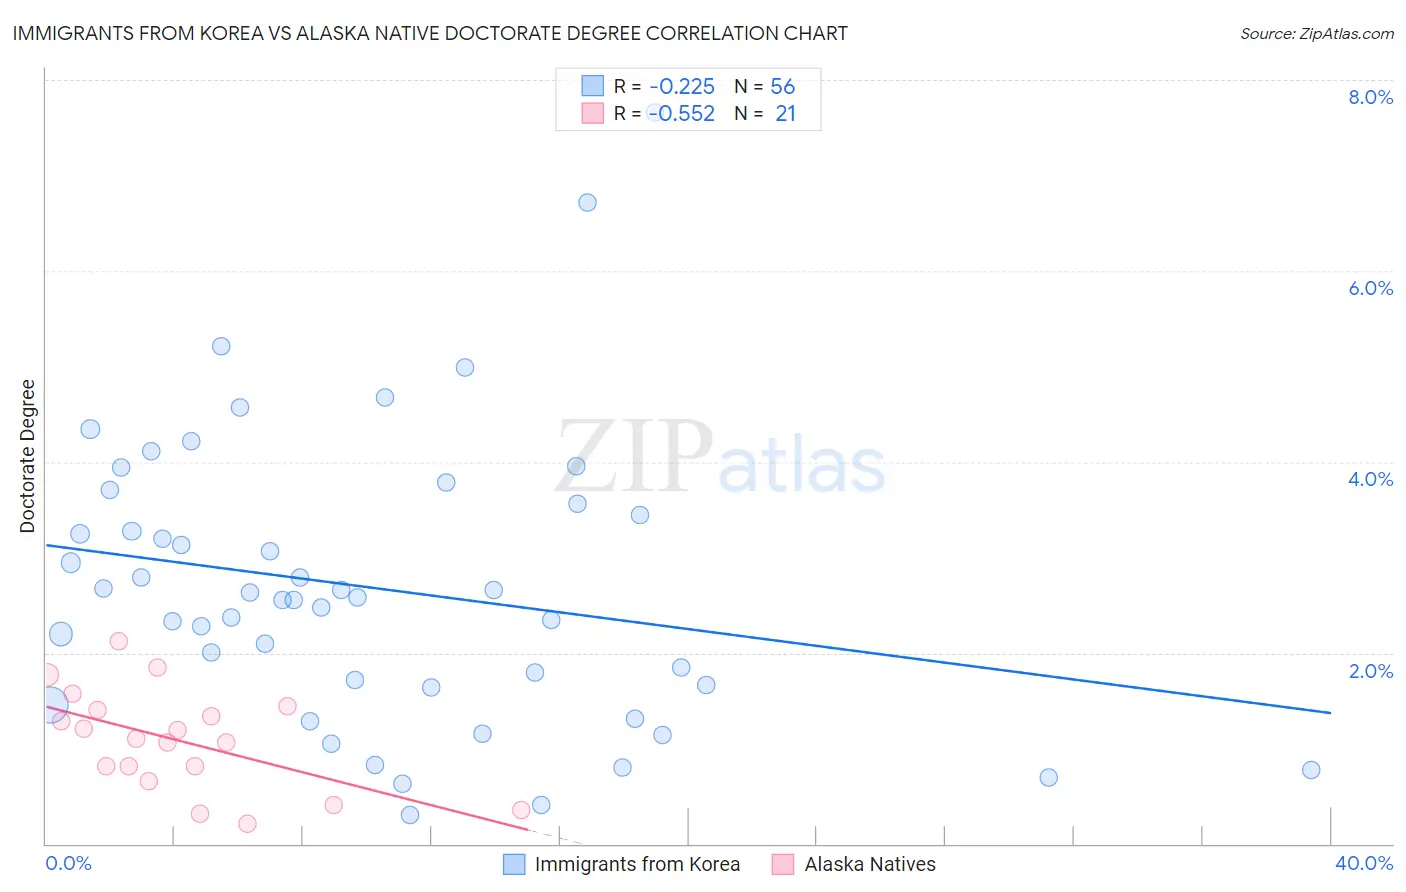
Immigrants from Korea vs Alaska Native Doctorate Degree Correlation Chart
The statistical analysis conducted on geographies consisting of 412,960,054 people shows a weak negative correlation between the proportion of Immigrants from Korea and percentage of population with at least doctorate degree education in the United States with a correlation coefficient (R) of -0.225 and weighted average of 2.6%. Similarly, the statistical analysis conducted on geographies consisting of 76,370,977 people shows a substantial negative correlation between the proportion of Alaska Natives and percentage of population with at least doctorate degree education in the United States with a correlation coefficient (R) of -0.552 and weighted average of 1.4%, a difference of 82.5%.
Doctorate Degree Correlation Summary
| Measurement | Immigrants from Korea | Alaska Native |
| Minimum | 0.30% | 0.21% |
| Maximum | 7.7% | 2.1% |
| Range | 7.3% | 1.9% |
| Mean | 2.7% | 1.1% |
| Median | 2.6% | 1.1% |
| Interquartile 25% (IQ1) | 1.7% | 0.73% |
| Interquartile 75% (IQ3) | 3.5% | 1.4% |
| Interquartile Range (IQR) | 1.8% | 0.69% |
| Standard Deviation (Sample) | 1.5% | 0.53% |
| Standard Deviation (Population) | 1.5% | 0.51% |
Similar Demographics by Doctorate Degree
Demographics Similar to Immigrants from Korea by Doctorate Degree
In terms of doctorate degree, the demographic groups most similar to Immigrants from Korea are Immigrants from South Central Asia (2.6%, a difference of 0.040%), Burmese (2.6%, a difference of 0.30%), Immigrants from Turkey (2.6%, a difference of 0.61%), Turkish (2.7%, a difference of 1.5%), and Latvian (2.6%, a difference of 2.0%).
| Demographics | Rating | Rank | Doctorate Degree |
| Immigrants | Denmark | 100.0 /100 | #23 | Exceptional 2.8% |
| Israelis | 100.0 /100 | #24 | Exceptional 2.7% |
| Immigrants | Saudi Arabia | 100.0 /100 | #25 | Exceptional 2.7% |
| Turks | 100.0 /100 | #26 | Exceptional 2.7% |
| Immigrants | Turkey | 100.0 /100 | #27 | Exceptional 2.6% |
| Burmese | 100.0 /100 | #28 | Exceptional 2.6% |
| Immigrants | South Central Asia | 100.0 /100 | #29 | Exceptional 2.6% |
| Immigrants | Korea | 100.0 /100 | #30 | Exceptional 2.6% |
| Latvians | 100.0 /100 | #31 | Exceptional 2.6% |
| Immigrants | Northern Europe | 100.0 /100 | #32 | Exceptional 2.6% |
| Cambodians | 100.0 /100 | #33 | Exceptional 2.6% |
| Cypriots | 100.0 /100 | #34 | Exceptional 2.6% |
| Immigrants | Malaysia | 100.0 /100 | #35 | Exceptional 2.6% |
| Immigrants | Spain | 100.0 /100 | #36 | Exceptional 2.6% |
| Immigrants | Kuwait | 100.0 /100 | #37 | Exceptional 2.6% |
Demographics Similar to Alaska Natives by Doctorate Degree
In terms of doctorate degree, the demographic groups most similar to Alaska Natives are Black/African American (1.4%, a difference of 0.17%), Choctaw (1.4%, a difference of 0.40%), Cape Verdean (1.4%, a difference of 0.42%), Immigrants from El Salvador (1.4%, a difference of 0.55%), and Immigrants from Yemen (1.4%, a difference of 0.59%).
| Demographics | Rating | Rank | Doctorate Degree |
| Malaysians | 0.3 /100 | #285 | Tragic 1.5% |
| Cherokee | 0.3 /100 | #286 | Tragic 1.5% |
| Cajuns | 0.3 /100 | #287 | Tragic 1.5% |
| Immigrants | El Salvador | 0.3 /100 | #288 | Tragic 1.4% |
| Cape Verdeans | 0.3 /100 | #289 | Tragic 1.4% |
| Choctaw | 0.3 /100 | #290 | Tragic 1.4% |
| Blacks/African Americans | 0.3 /100 | #291 | Tragic 1.4% |
| Alaska Natives | 0.3 /100 | #292 | Tragic 1.4% |
| Immigrants | Yemen | 0.2 /100 | #293 | Tragic 1.4% |
| Samoans | 0.2 /100 | #294 | Tragic 1.4% |
| Guatemalans | 0.2 /100 | #295 | Tragic 1.4% |
| Immigrants | Ecuador | 0.2 /100 | #296 | Tragic 1.4% |
| Tsimshian | 0.2 /100 | #297 | Tragic 1.4% |
| Puerto Ricans | 0.1 /100 | #298 | Tragic 1.4% |
| Belizeans | 0.1 /100 | #299 | Tragic 1.4% |