Immigrants from Korea vs Iroquois Doctorate Degree
COMPARE
Immigrants from Korea
Iroquois
Doctorate Degree
Doctorate Degree Comparison
Immigrants from Korea
Iroquois
2.6%
DOCTORATE DEGREE
100.0/ 100
METRIC RATING
30th/ 347
METRIC RANK
1.6%
DOCTORATE DEGREE
2.7/ 100
METRIC RATING
237th/ 347
METRIC RANK
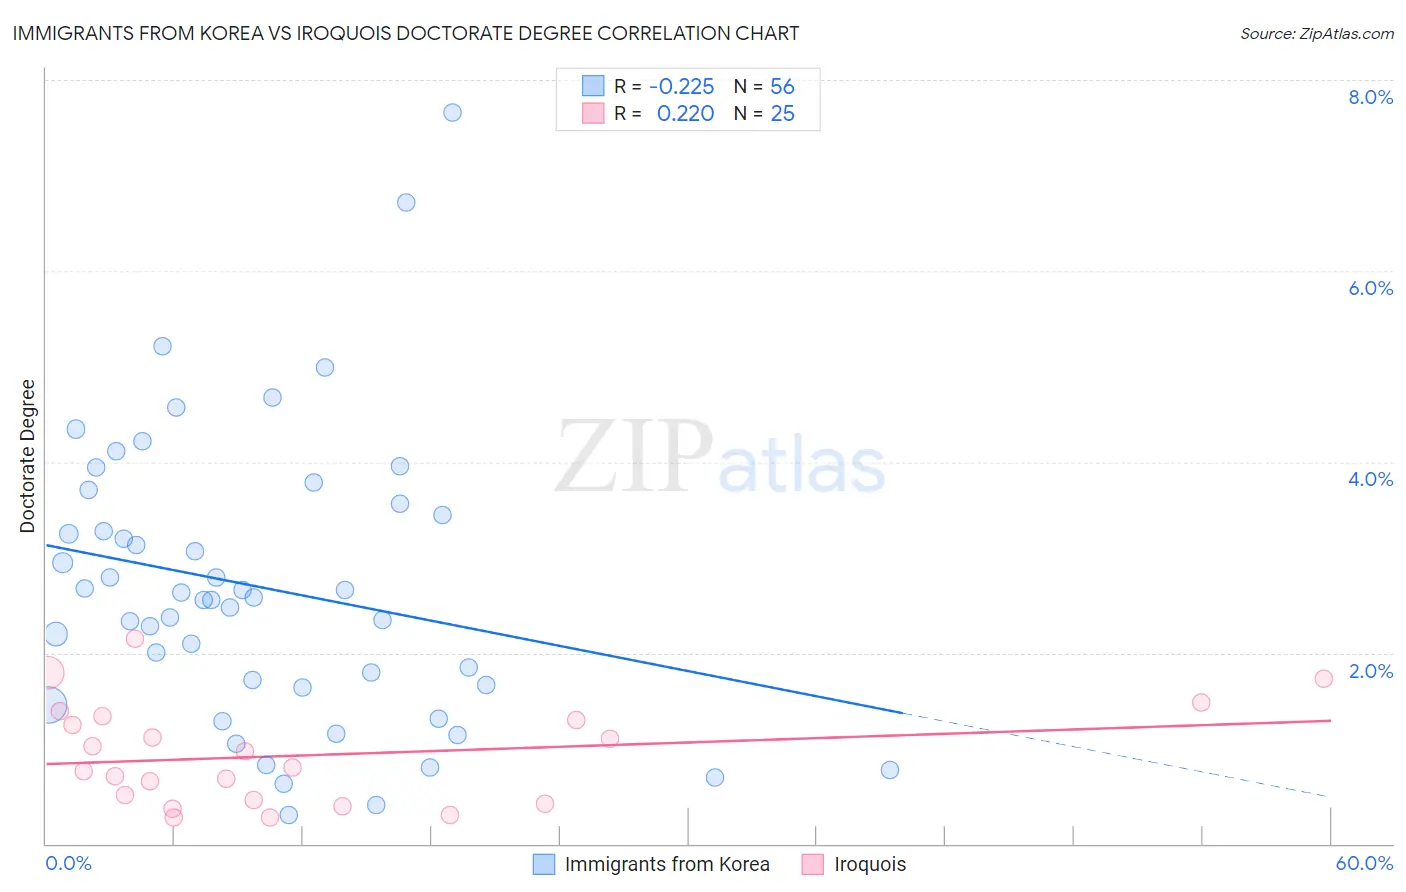
Immigrants from Korea vs Iroquois Doctorate Degree Correlation Chart
The statistical analysis conducted on geographies consisting of 412,960,054 people shows a weak negative correlation between the proportion of Immigrants from Korea and percentage of population with at least doctorate degree education in the United States with a correlation coefficient (R) of -0.225 and weighted average of 2.6%. Similarly, the statistical analysis conducted on geographies consisting of 205,583,939 people shows a weak positive correlation between the proportion of Iroquois and percentage of population with at least doctorate degree education in the United States with a correlation coefficient (R) of 0.220 and weighted average of 1.6%, a difference of 64.5%.
Doctorate Degree Correlation Summary
| Measurement | Immigrants from Korea | Iroquois |
| Minimum | 0.30% | 0.27% |
| Maximum | 7.7% | 2.1% |
| Range | 7.3% | 1.9% |
| Mean | 2.7% | 0.93% |
| Median | 2.6% | 0.80% |
| Interquartile 25% (IQ1) | 1.7% | 0.44% |
| Interquartile 75% (IQ3) | 3.5% | 1.3% |
| Interquartile Range (IQR) | 1.8% | 0.87% |
| Standard Deviation (Sample) | 1.5% | 0.53% |
| Standard Deviation (Population) | 1.5% | 0.51% |
Similar Demographics by Doctorate Degree
Demographics Similar to Immigrants from Korea by Doctorate Degree
In terms of doctorate degree, the demographic groups most similar to Immigrants from Korea are Immigrants from South Central Asia (2.6%, a difference of 0.040%), Burmese (2.6%, a difference of 0.30%), Immigrants from Turkey (2.6%, a difference of 0.61%), Turkish (2.7%, a difference of 1.5%), and Latvian (2.6%, a difference of 2.0%).
| Demographics | Rating | Rank | Doctorate Degree |
| Immigrants | Denmark | 100.0 /100 | #23 | Exceptional 2.8% |
| Israelis | 100.0 /100 | #24 | Exceptional 2.7% |
| Immigrants | Saudi Arabia | 100.0 /100 | #25 | Exceptional 2.7% |
| Turks | 100.0 /100 | #26 | Exceptional 2.7% |
| Immigrants | Turkey | 100.0 /100 | #27 | Exceptional 2.6% |
| Burmese | 100.0 /100 | #28 | Exceptional 2.6% |
| Immigrants | South Central Asia | 100.0 /100 | #29 | Exceptional 2.6% |
| Immigrants | Korea | 100.0 /100 | #30 | Exceptional 2.6% |
| Latvians | 100.0 /100 | #31 | Exceptional 2.6% |
| Immigrants | Northern Europe | 100.0 /100 | #32 | Exceptional 2.6% |
| Cambodians | 100.0 /100 | #33 | Exceptional 2.6% |
| Cypriots | 100.0 /100 | #34 | Exceptional 2.6% |
| Immigrants | Malaysia | 100.0 /100 | #35 | Exceptional 2.6% |
| Immigrants | Spain | 100.0 /100 | #36 | Exceptional 2.6% |
| Immigrants | Kuwait | 100.0 /100 | #37 | Exceptional 2.6% |
Demographics Similar to Iroquois by Doctorate Degree
In terms of doctorate degree, the demographic groups most similar to Iroquois are Indonesian (1.6%, a difference of 0.19%), Immigrants from Congo (1.6%, a difference of 0.20%), West Indian (1.6%, a difference of 0.31%), Cree (1.6%, a difference of 0.47%), and Immigrants from Panama (1.6%, a difference of 0.50%).
| Demographics | Rating | Rank | Doctorate Degree |
| Immigrants | Philippines | 4.3 /100 | #230 | Tragic 1.6% |
| Immigrants | North Macedonia | 3.9 /100 | #231 | Tragic 1.6% |
| Guamanians/Chamorros | 3.3 /100 | #232 | Tragic 1.6% |
| Barbadians | 3.3 /100 | #233 | Tragic 1.6% |
| Hopi | 3.2 /100 | #234 | Tragic 1.6% |
| Cree | 3.0 /100 | #235 | Tragic 1.6% |
| Indonesians | 2.8 /100 | #236 | Tragic 1.6% |
| Iroquois | 2.7 /100 | #237 | Tragic 1.6% |
| Immigrants | Congo | 2.6 /100 | #238 | Tragic 1.6% |
| West Indians | 2.5 /100 | #239 | Tragic 1.6% |
| Immigrants | Panama | 2.4 /100 | #240 | Tragic 1.6% |
| Cheyenne | 2.3 /100 | #241 | Tragic 1.6% |
| Ottawa | 2.2 /100 | #242 | Tragic 1.6% |
| Native Hawaiians | 2.1 /100 | #243 | Tragic 1.6% |
| French American Indians | 2.0 /100 | #244 | Tragic 1.6% |