Immigrants from England vs Palestinian Doctorate Degree
COMPARE
Immigrants from England
Palestinian
Doctorate Degree
Doctorate Degree Comparison
Immigrants from England
Palestinians
2.2%
DOCTORATE DEGREE
99.6/ 100
METRIC RATING
84th/ 347
METRIC RANK
2.0%
DOCTORATE DEGREE
92.0/ 100
METRIC RATING
127th/ 347
METRIC RANK
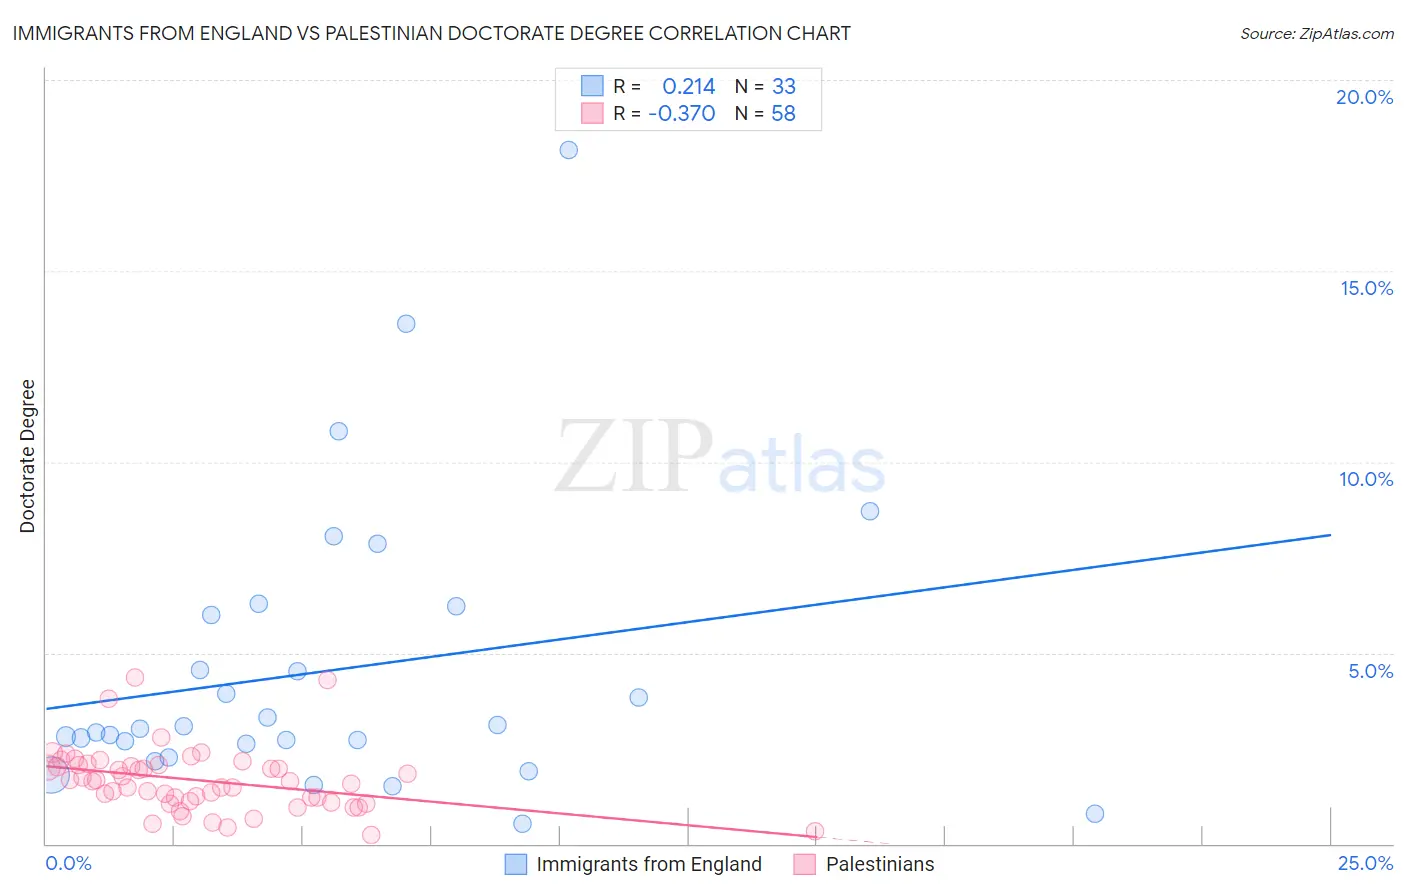
Immigrants from England vs Palestinian Doctorate Degree Correlation Chart
The statistical analysis conducted on geographies consisting of 388,548,002 people shows a weak positive correlation between the proportion of Immigrants from England and percentage of population with at least doctorate degree education in the United States with a correlation coefficient (R) of 0.214 and weighted average of 2.2%. Similarly, the statistical analysis conducted on geographies consisting of 215,891,149 people shows a mild negative correlation between the proportion of Palestinians and percentage of population with at least doctorate degree education in the United States with a correlation coefficient (R) of -0.370 and weighted average of 2.0%, a difference of 10.1%.
Doctorate Degree Correlation Summary
| Measurement | Immigrants from England | Palestinian |
| Minimum | 0.53% | 0.24% |
| Maximum | 18.2% | 4.4% |
| Range | 17.7% | 4.1% |
| Mean | 4.5% | 1.7% |
| Median | 3.0% | 1.6% |
| Interquartile 25% (IQ1) | 2.4% | 1.1% |
| Interquartile 75% (IQ3) | 6.1% | 2.1% |
| Interquartile Range (IQR) | 3.7% | 0.95% |
| Standard Deviation (Sample) | 3.8% | 0.83% |
| Standard Deviation (Population) | 3.8% | 0.82% |
Similar Demographics by Doctorate Degree
Demographics Similar to Immigrants from England by Doctorate Degree
In terms of doctorate degree, the demographic groups most similar to Immigrants from England are Immigrants from Brazil (2.2%, a difference of 0.13%), Immigrants from Lithuania (2.2%, a difference of 0.14%), Immigrants from Uganda (2.2%, a difference of 0.32%), Egyptian (2.2%, a difference of 0.83%), and Immigrants from Argentina (2.2%, a difference of 0.86%).
| Demographics | Rating | Rank | Doctorate Degree |
| Immigrants | Lebanon | 99.8 /100 | #77 | Exceptional 2.2% |
| Immigrants | Belarus | 99.7 /100 | #78 | Exceptional 2.2% |
| Northern Europeans | 99.7 /100 | #79 | Exceptional 2.2% |
| Ugandans | 99.7 /100 | #80 | Exceptional 2.2% |
| Immigrants | Argentina | 99.7 /100 | #81 | Exceptional 2.2% |
| Immigrants | Uganda | 99.6 /100 | #82 | Exceptional 2.2% |
| Immigrants | Lithuania | 99.6 /100 | #83 | Exceptional 2.2% |
| Immigrants | England | 99.6 /100 | #84 | Exceptional 2.2% |
| Immigrants | Brazil | 99.6 /100 | #85 | Exceptional 2.2% |
| Egyptians | 99.4 /100 | #86 | Exceptional 2.2% |
| Immigrants | Zimbabwe | 99.4 /100 | #87 | Exceptional 2.2% |
| Immigrants | Nepal | 99.3 /100 | #88 | Exceptional 2.2% |
| British | 99.3 /100 | #89 | Exceptional 2.2% |
| Immigrants | Scotland | 99.2 /100 | #90 | Exceptional 2.2% |
| Immigrants | Sudan | 99.1 /100 | #91 | Exceptional 2.2% |
Demographics Similar to Palestinians by Doctorate Degree
In terms of doctorate degree, the demographic groups most similar to Palestinians are Jordanian (2.0%, a difference of 0.040%), Immigrants from Zaire (2.0%, a difference of 0.42%), Moroccan (2.0%, a difference of 0.45%), Ute (2.0%, a difference of 0.56%), and Canadian (2.0%, a difference of 0.63%).
| Demographics | Rating | Rank | Doctorate Degree |
| Immigrants | Morocco | 95.5 /100 | #120 | Exceptional 2.0% |
| Immigrants | Jordan | 94.8 /100 | #121 | Exceptional 2.0% |
| Immigrants | Southern Europe | 94.7 /100 | #122 | Exceptional 2.0% |
| Croatians | 94.0 /100 | #123 | Exceptional 2.0% |
| Ute | 93.2 /100 | #124 | Exceptional 2.0% |
| Moroccans | 93.0 /100 | #125 | Exceptional 2.0% |
| Jordanians | 92.1 /100 | #126 | Exceptional 2.0% |
| Palestinians | 92.0 /100 | #127 | Exceptional 2.0% |
| Immigrants | Zaire | 91.1 /100 | #128 | Exceptional 2.0% |
| Canadians | 90.6 /100 | #129 | Exceptional 2.0% |
| Immigrants | Ukraine | 90.5 /100 | #130 | Exceptional 2.0% |
| Immigrants | Sierra Leone | 90.2 /100 | #131 | Exceptional 2.0% |
| Scottish | 89.4 /100 | #132 | Excellent 2.0% |
| Immigrants | Uzbekistan | 89.3 /100 | #133 | Excellent 2.0% |
| Immigrants | Cameroon | 88.9 /100 | #134 | Excellent 2.0% |