Immigrants from Korea vs Colombian Doctorate Degree
COMPARE
Immigrants from Korea
Colombian
Doctorate Degree
Doctorate Degree Comparison
Immigrants from Korea
Colombians
2.6%
DOCTORATE DEGREE
100.0/ 100
METRIC RATING
30th/ 347
METRIC RANK
1.7%
DOCTORATE DEGREE
16.1/ 100
METRIC RATING
208th/ 347
METRIC RANK
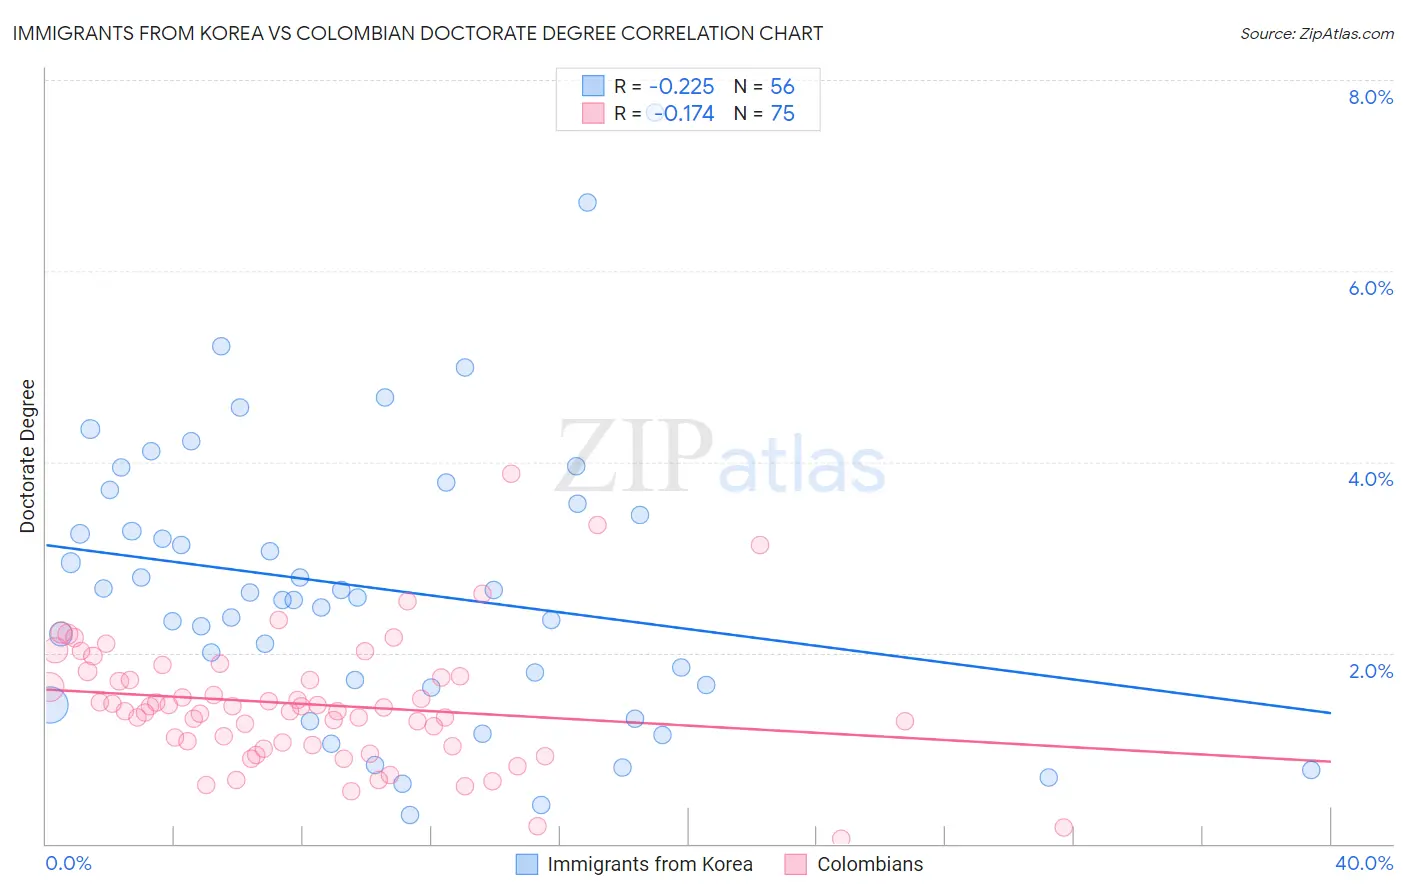
Immigrants from Korea vs Colombian Doctorate Degree Correlation Chart
The statistical analysis conducted on geographies consisting of 412,960,054 people shows a weak negative correlation between the proportion of Immigrants from Korea and percentage of population with at least doctorate degree education in the United States with a correlation coefficient (R) of -0.225 and weighted average of 2.6%. Similarly, the statistical analysis conducted on geographies consisting of 415,824,999 people shows a poor negative correlation between the proportion of Colombians and percentage of population with at least doctorate degree education in the United States with a correlation coefficient (R) of -0.174 and weighted average of 1.7%, a difference of 52.1%.
Doctorate Degree Correlation Summary
| Measurement | Immigrants from Korea | Colombian |
| Minimum | 0.30% | 0.049% |
| Maximum | 7.7% | 3.9% |
| Range | 7.3% | 3.8% |
| Mean | 2.7% | 1.5% |
| Median | 2.6% | 1.4% |
| Interquartile 25% (IQ1) | 1.7% | 1.0% |
| Interquartile 75% (IQ3) | 3.5% | 1.8% |
| Interquartile Range (IQR) | 1.8% | 0.72% |
| Standard Deviation (Sample) | 1.5% | 0.67% |
| Standard Deviation (Population) | 1.5% | 0.67% |
Similar Demographics by Doctorate Degree
Demographics Similar to Immigrants from Korea by Doctorate Degree
In terms of doctorate degree, the demographic groups most similar to Immigrants from Korea are Immigrants from South Central Asia (2.6%, a difference of 0.040%), Burmese (2.6%, a difference of 0.30%), Immigrants from Turkey (2.6%, a difference of 0.61%), Turkish (2.7%, a difference of 1.5%), and Latvian (2.6%, a difference of 2.0%).
| Demographics | Rating | Rank | Doctorate Degree |
| Immigrants | Denmark | 100.0 /100 | #23 | Exceptional 2.8% |
| Israelis | 100.0 /100 | #24 | Exceptional 2.7% |
| Immigrants | Saudi Arabia | 100.0 /100 | #25 | Exceptional 2.7% |
| Turks | 100.0 /100 | #26 | Exceptional 2.7% |
| Immigrants | Turkey | 100.0 /100 | #27 | Exceptional 2.6% |
| Burmese | 100.0 /100 | #28 | Exceptional 2.6% |
| Immigrants | South Central Asia | 100.0 /100 | #29 | Exceptional 2.6% |
| Immigrants | Korea | 100.0 /100 | #30 | Exceptional 2.6% |
| Latvians | 100.0 /100 | #31 | Exceptional 2.6% |
| Immigrants | Northern Europe | 100.0 /100 | #32 | Exceptional 2.6% |
| Cambodians | 100.0 /100 | #33 | Exceptional 2.6% |
| Cypriots | 100.0 /100 | #34 | Exceptional 2.6% |
| Immigrants | Malaysia | 100.0 /100 | #35 | Exceptional 2.6% |
| Immigrants | Spain | 100.0 /100 | #36 | Exceptional 2.6% |
| Immigrants | Kuwait | 100.0 /100 | #37 | Exceptional 2.6% |
Demographics Similar to Colombians by Doctorate Degree
In terms of doctorate degree, the demographic groups most similar to Colombians are Immigrants from Western Africa (1.7%, a difference of 0.19%), Tongan (1.7%, a difference of 0.27%), Yugoslavian (1.7%, a difference of 0.28%), Immigrants from Armenia (1.7%, a difference of 0.29%), and Immigrants from South Eastern Asia (1.7%, a difference of 0.41%).
| Demographics | Rating | Rank | Doctorate Degree |
| Immigrants | Nigeria | 22.4 /100 | #201 | Fair 1.8% |
| Portuguese | 21.4 /100 | #202 | Fair 1.8% |
| Immigrants | Vietnam | 21.4 /100 | #203 | Fair 1.8% |
| Somalis | 21.2 /100 | #204 | Fair 1.7% |
| Venezuelans | 19.5 /100 | #205 | Poor 1.7% |
| Immigrants | Peru | 17.6 /100 | #206 | Poor 1.7% |
| Yugoslavians | 17.1 /100 | #207 | Poor 1.7% |
| Colombians | 16.1 /100 | #208 | Poor 1.7% |
| Immigrants | Western Africa | 15.4 /100 | #209 | Poor 1.7% |
| Tongans | 15.1 /100 | #210 | Poor 1.7% |
| Immigrants | Armenia | 15.1 /100 | #211 | Poor 1.7% |
| Immigrants | South Eastern Asia | 14.7 /100 | #212 | Poor 1.7% |
| Koreans | 14.2 /100 | #213 | Poor 1.7% |
| Pueblo | 14.2 /100 | #214 | Poor 1.7% |
| Alaskan Athabascans | 13.8 /100 | #215 | Poor 1.7% |