Immigrants from Bahamas vs Palestinian Doctorate Degree
COMPARE
Immigrants from Bahamas
Palestinian
Doctorate Degree
Doctorate Degree Comparison
Immigrants from Bahamas
Palestinians
1.5%
DOCTORATE DEGREE
0.7/ 100
METRIC RATING
263rd/ 347
METRIC RANK
2.0%
DOCTORATE DEGREE
92.0/ 100
METRIC RATING
127th/ 347
METRIC RANK
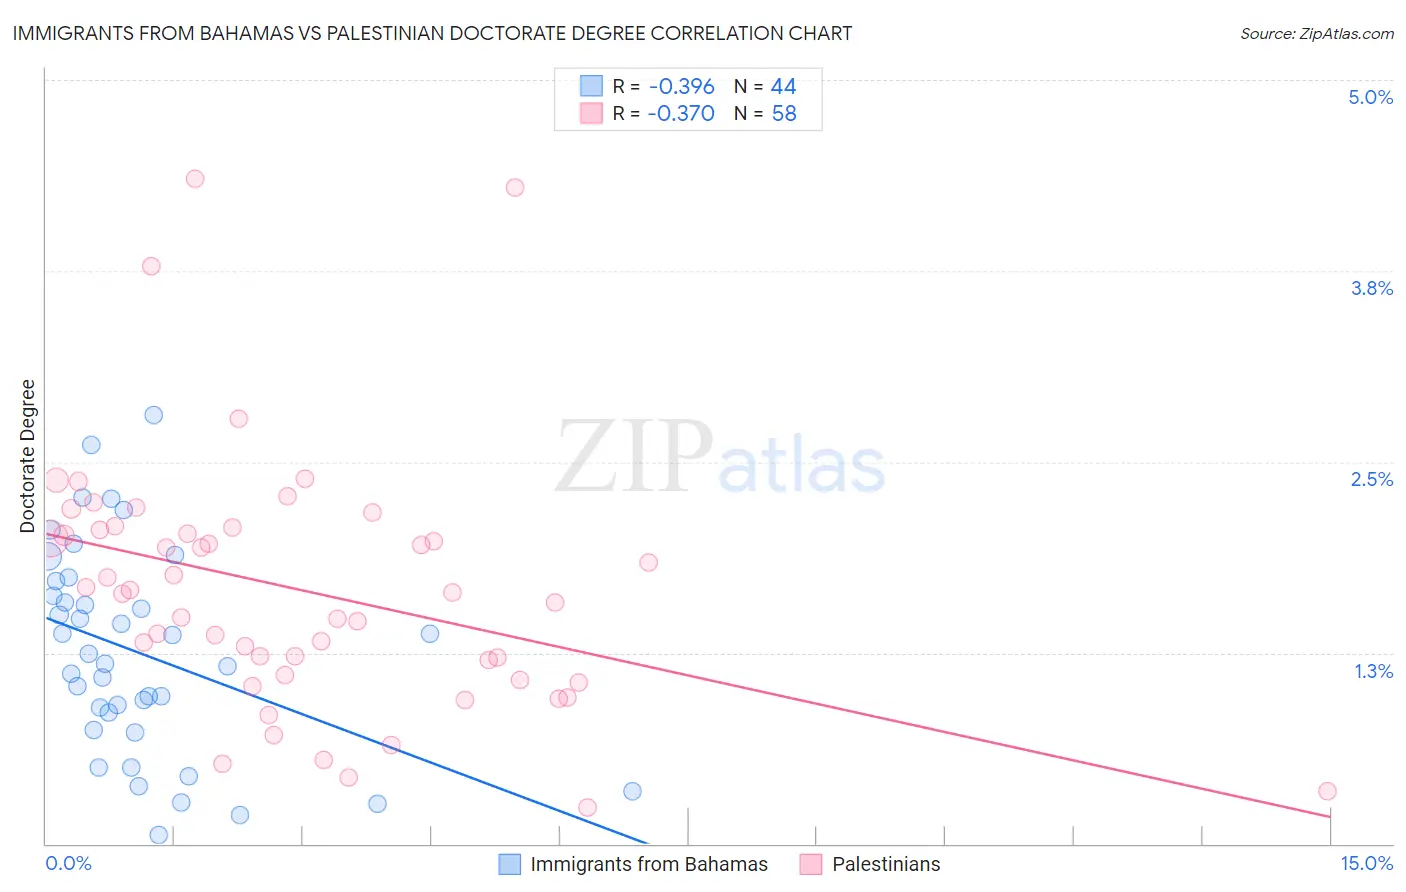
Immigrants from Bahamas vs Palestinian Doctorate Degree Correlation Chart
The statistical analysis conducted on geographies consisting of 104,472,552 people shows a mild negative correlation between the proportion of Immigrants from Bahamas and percentage of population with at least doctorate degree education in the United States with a correlation coefficient (R) of -0.396 and weighted average of 1.5%. Similarly, the statistical analysis conducted on geographies consisting of 215,891,149 people shows a mild negative correlation between the proportion of Palestinians and percentage of population with at least doctorate degree education in the United States with a correlation coefficient (R) of -0.370 and weighted average of 2.0%, a difference of 33.0%.
Doctorate Degree Correlation Summary
| Measurement | Immigrants from Bahamas | Palestinian |
| Minimum | 0.056% | 0.24% |
| Maximum | 2.8% | 4.4% |
| Range | 2.7% | 4.1% |
| Mean | 1.2% | 1.7% |
| Median | 1.2% | 1.6% |
| Interquartile 25% (IQ1) | 0.80% | 1.1% |
| Interquartile 75% (IQ3) | 1.7% | 2.1% |
| Interquartile Range (IQR) | 0.87% | 0.95% |
| Standard Deviation (Sample) | 0.67% | 0.83% |
| Standard Deviation (Population) | 0.66% | 0.82% |
Similar Demographics by Doctorate Degree
Demographics Similar to Immigrants from Bahamas by Doctorate Degree
In terms of doctorate degree, the demographic groups most similar to Immigrants from Bahamas are Chickasaw (1.5%, a difference of 0.17%), Blackfeet (1.5%, a difference of 0.18%), Immigrants from Portugal (1.5%, a difference of 0.32%), Nicaraguan (1.5%, a difference of 0.47%), and Japanese (1.5%, a difference of 0.79%).
| Demographics | Rating | Rank | Doctorate Degree |
| Central American Indians | 1.0 /100 | #256 | Tragic 1.5% |
| Chippewa | 0.9 /100 | #257 | Tragic 1.5% |
| Immigrants | West Indies | 0.9 /100 | #258 | Tragic 1.5% |
| Liberians | 0.9 /100 | #259 | Tragic 1.5% |
| Japanese | 0.9 /100 | #260 | Tragic 1.5% |
| Immigrants | Portugal | 0.8 /100 | #261 | Tragic 1.5% |
| Chickasaw | 0.7 /100 | #262 | Tragic 1.5% |
| Immigrants | Bahamas | 0.7 /100 | #263 | Tragic 1.5% |
| Blackfeet | 0.7 /100 | #264 | Tragic 1.5% |
| Nicaraguans | 0.6 /100 | #265 | Tragic 1.5% |
| Immigrants | Liberia | 0.5 /100 | #266 | Tragic 1.5% |
| Kiowa | 0.5 /100 | #267 | Tragic 1.5% |
| U.S. Virgin Islanders | 0.5 /100 | #268 | Tragic 1.5% |
| Crow | 0.5 /100 | #269 | Tragic 1.5% |
| Salvadorans | 0.5 /100 | #270 | Tragic 1.5% |
Demographics Similar to Palestinians by Doctorate Degree
In terms of doctorate degree, the demographic groups most similar to Palestinians are Jordanian (2.0%, a difference of 0.040%), Immigrants from Zaire (2.0%, a difference of 0.42%), Moroccan (2.0%, a difference of 0.45%), Ute (2.0%, a difference of 0.56%), and Canadian (2.0%, a difference of 0.63%).
| Demographics | Rating | Rank | Doctorate Degree |
| Immigrants | Morocco | 95.5 /100 | #120 | Exceptional 2.0% |
| Immigrants | Jordan | 94.8 /100 | #121 | Exceptional 2.0% |
| Immigrants | Southern Europe | 94.7 /100 | #122 | Exceptional 2.0% |
| Croatians | 94.0 /100 | #123 | Exceptional 2.0% |
| Ute | 93.2 /100 | #124 | Exceptional 2.0% |
| Moroccans | 93.0 /100 | #125 | Exceptional 2.0% |
| Jordanians | 92.1 /100 | #126 | Exceptional 2.0% |
| Palestinians | 92.0 /100 | #127 | Exceptional 2.0% |
| Immigrants | Zaire | 91.1 /100 | #128 | Exceptional 2.0% |
| Canadians | 90.6 /100 | #129 | Exceptional 2.0% |
| Immigrants | Ukraine | 90.5 /100 | #130 | Exceptional 2.0% |
| Immigrants | Sierra Leone | 90.2 /100 | #131 | Exceptional 2.0% |
| Scottish | 89.4 /100 | #132 | Excellent 2.0% |
| Immigrants | Uzbekistan | 89.3 /100 | #133 | Excellent 2.0% |
| Immigrants | Cameroon | 88.9 /100 | #134 | Excellent 2.0% |