Immigrants from Spain vs Palestinian Doctorate Degree
COMPARE
Immigrants from Spain
Palestinian
Doctorate Degree
Doctorate Degree Comparison
Immigrants from Spain
Palestinians
2.6%
DOCTORATE DEGREE
100.0/ 100
METRIC RATING
36th/ 347
METRIC RANK
2.0%
DOCTORATE DEGREE
92.0/ 100
METRIC RATING
127th/ 347
METRIC RANK
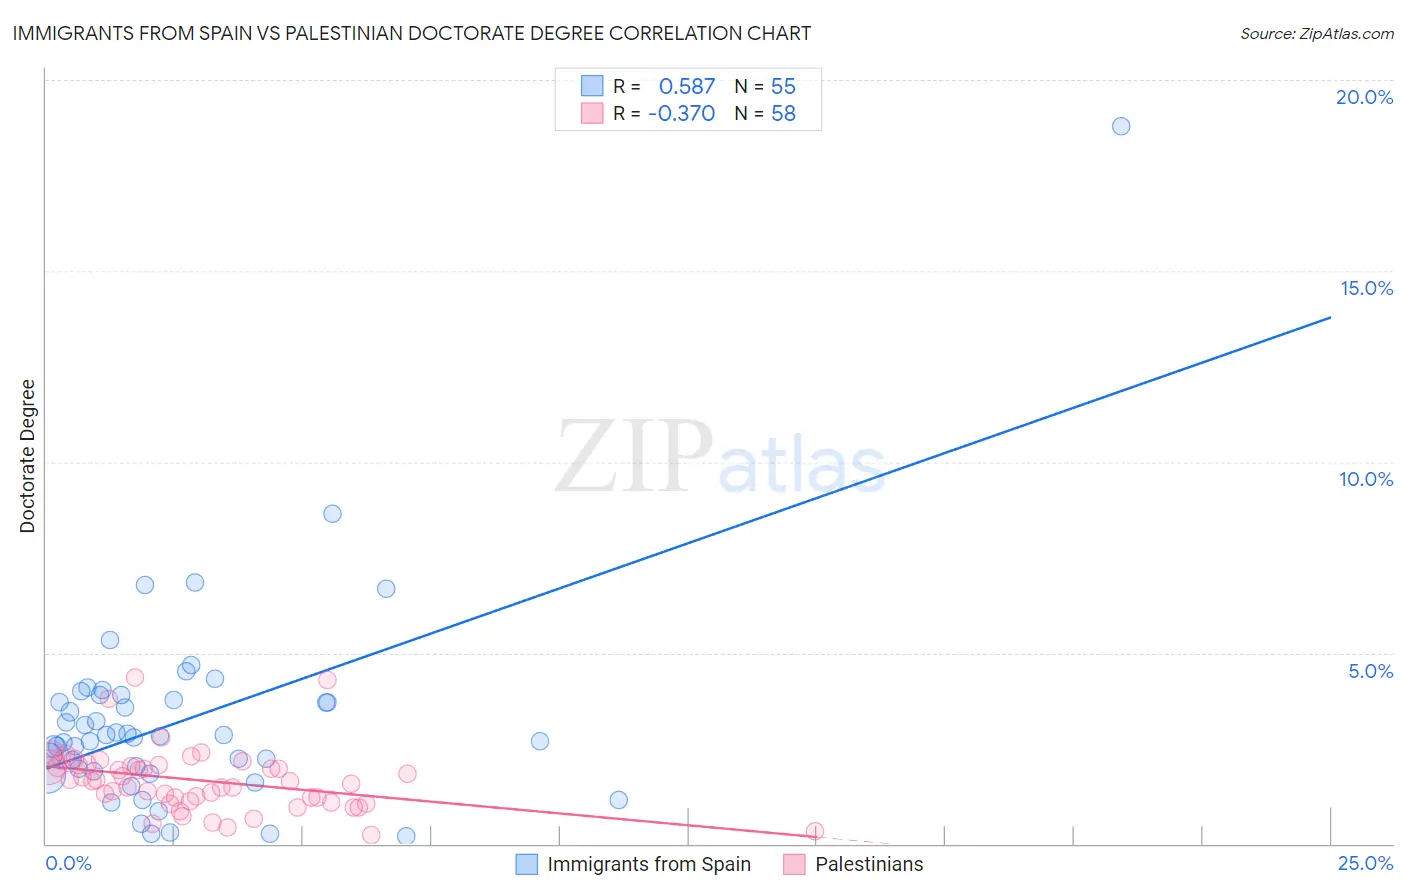
Immigrants from Spain vs Palestinian Doctorate Degree Correlation Chart
The statistical analysis conducted on geographies consisting of 238,840,570 people shows a substantial positive correlation between the proportion of Immigrants from Spain and percentage of population with at least doctorate degree education in the United States with a correlation coefficient (R) of 0.587 and weighted average of 2.6%. Similarly, the statistical analysis conducted on geographies consisting of 215,891,149 people shows a mild negative correlation between the proportion of Palestinians and percentage of population with at least doctorate degree education in the United States with a correlation coefficient (R) of -0.370 and weighted average of 2.0%, a difference of 27.9%.
Doctorate Degree Correlation Summary
| Measurement | Immigrants from Spain | Palestinian |
| Minimum | 0.19% | 0.24% |
| Maximum | 18.8% | 4.4% |
| Range | 18.6% | 4.1% |
| Mean | 3.2% | 1.7% |
| Median | 2.8% | 1.6% |
| Interquartile 25% (IQ1) | 1.9% | 1.1% |
| Interquartile 75% (IQ3) | 3.9% | 2.1% |
| Interquartile Range (IQR) | 2.0% | 0.95% |
| Standard Deviation (Sample) | 2.7% | 0.83% |
| Standard Deviation (Population) | 2.7% | 0.82% |
Similar Demographics by Doctorate Degree
Demographics Similar to Immigrants from Spain by Doctorate Degree
In terms of doctorate degree, the demographic groups most similar to Immigrants from Spain are Immigrants from Malaysia (2.6%, a difference of 0.060%), Cypriot (2.6%, a difference of 0.12%), Cambodian (2.6%, a difference of 0.23%), Immigrants from Kuwait (2.6%, a difference of 0.26%), and Immigrants from Northern Europe (2.6%, a difference of 0.41%).
| Demographics | Rating | Rank | Doctorate Degree |
| Immigrants | South Central Asia | 100.0 /100 | #29 | Exceptional 2.6% |
| Immigrants | Korea | 100.0 /100 | #30 | Exceptional 2.6% |
| Latvians | 100.0 /100 | #31 | Exceptional 2.6% |
| Immigrants | Northern Europe | 100.0 /100 | #32 | Exceptional 2.6% |
| Cambodians | 100.0 /100 | #33 | Exceptional 2.6% |
| Cypriots | 100.0 /100 | #34 | Exceptional 2.6% |
| Immigrants | Malaysia | 100.0 /100 | #35 | Exceptional 2.6% |
| Immigrants | Spain | 100.0 /100 | #36 | Exceptional 2.6% |
| Immigrants | Kuwait | 100.0 /100 | #37 | Exceptional 2.6% |
| Russians | 100.0 /100 | #38 | Exceptional 2.6% |
| Immigrants | Ireland | 100.0 /100 | #39 | Exceptional 2.5% |
| Estonians | 100.0 /100 | #40 | Exceptional 2.5% |
| Immigrants | Russia | 100.0 /100 | #41 | Exceptional 2.5% |
| New Zealanders | 100.0 /100 | #42 | Exceptional 2.5% |
| Soviet Union | 100.0 /100 | #43 | Exceptional 2.5% |
Demographics Similar to Palestinians by Doctorate Degree
In terms of doctorate degree, the demographic groups most similar to Palestinians are Jordanian (2.0%, a difference of 0.040%), Immigrants from Zaire (2.0%, a difference of 0.42%), Moroccan (2.0%, a difference of 0.45%), Ute (2.0%, a difference of 0.56%), and Canadian (2.0%, a difference of 0.63%).
| Demographics | Rating | Rank | Doctorate Degree |
| Immigrants | Morocco | 95.5 /100 | #120 | Exceptional 2.0% |
| Immigrants | Jordan | 94.8 /100 | #121 | Exceptional 2.0% |
| Immigrants | Southern Europe | 94.7 /100 | #122 | Exceptional 2.0% |
| Croatians | 94.0 /100 | #123 | Exceptional 2.0% |
| Ute | 93.2 /100 | #124 | Exceptional 2.0% |
| Moroccans | 93.0 /100 | #125 | Exceptional 2.0% |
| Jordanians | 92.1 /100 | #126 | Exceptional 2.0% |
| Palestinians | 92.0 /100 | #127 | Exceptional 2.0% |
| Immigrants | Zaire | 91.1 /100 | #128 | Exceptional 2.0% |
| Canadians | 90.6 /100 | #129 | Exceptional 2.0% |
| Immigrants | Ukraine | 90.5 /100 | #130 | Exceptional 2.0% |
| Immigrants | Sierra Leone | 90.2 /100 | #131 | Exceptional 2.0% |
| Scottish | 89.4 /100 | #132 | Excellent 2.0% |
| Immigrants | Uzbekistan | 89.3 /100 | #133 | Excellent 2.0% |
| Immigrants | Cameroon | 88.9 /100 | #134 | Excellent 2.0% |