Immigrants from Korea vs Palestinian Median Female Earnings
COMPARE
Immigrants from Korea
Palestinian
Median Female Earnings
Median Female Earnings Comparison
Immigrants from Korea
Palestinians
$44,847
MEDIAN FEMALE EARNINGS
100.0/ 100
METRIC RATING
24th/ 347
METRIC RANK
$41,484
MEDIAN FEMALE EARNINGS
97.6/ 100
METRIC RATING
107th/ 347
METRIC RANK
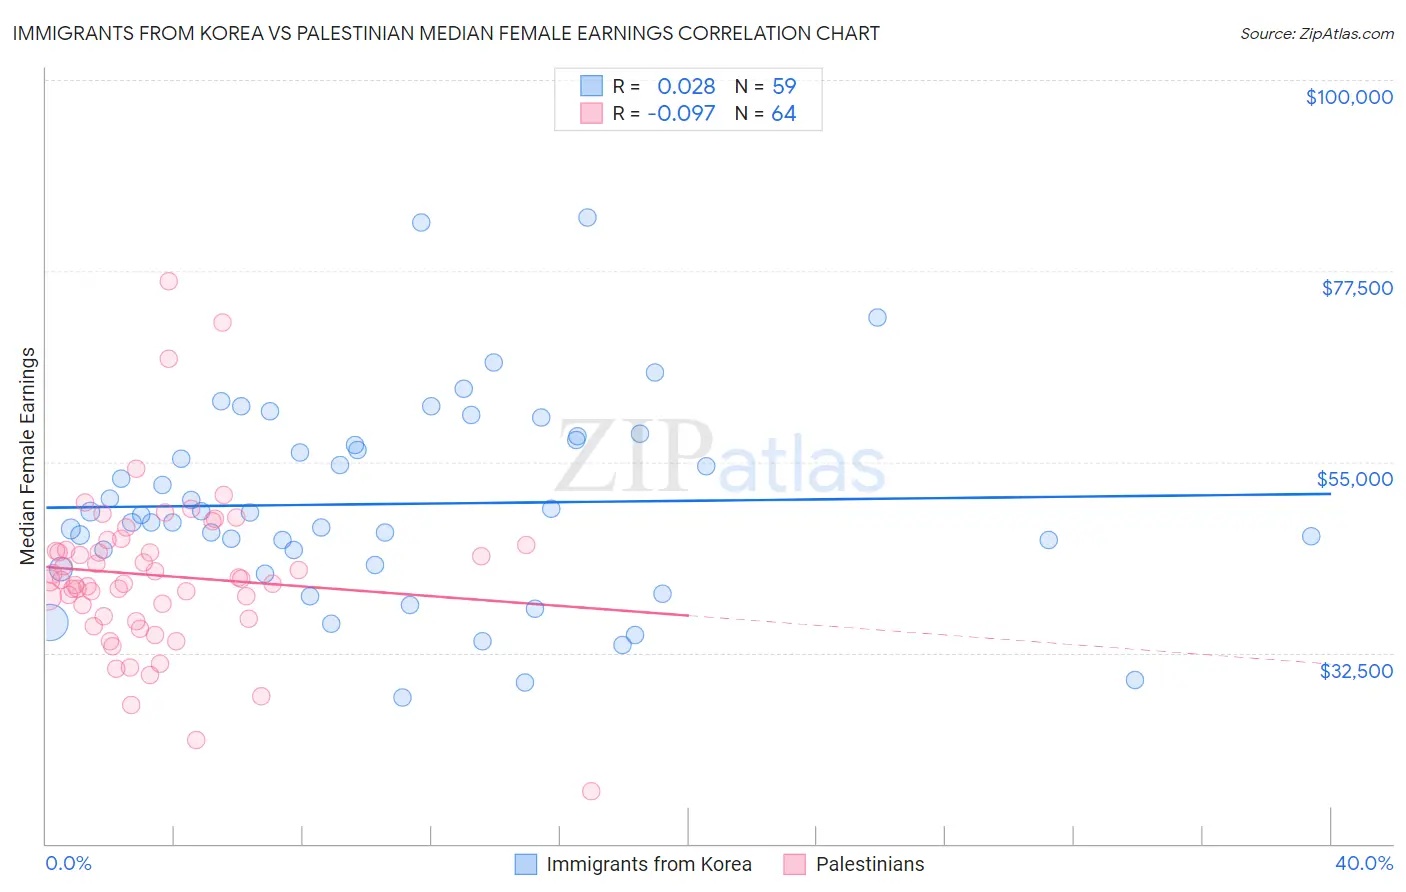
Immigrants from Korea vs Palestinian Median Female Earnings Correlation Chart
The statistical analysis conducted on geographies consisting of 416,108,696 people shows no correlation between the proportion of Immigrants from Korea and median female earnings in the United States with a correlation coefficient (R) of 0.028 and weighted average of $44,847. Similarly, the statistical analysis conducted on geographies consisting of 216,451,801 people shows a slight negative correlation between the proportion of Palestinians and median female earnings in the United States with a correlation coefficient (R) of -0.097 and weighted average of $41,484, a difference of 8.1%.
Median Female Earnings Correlation Summary
| Measurement | Immigrants from Korea | Palestinian |
| Minimum | $27,183 | $16,250 |
| Maximum | $83,750 | $76,295 |
| Range | $56,567 | $60,045 |
| Mean | $50,048 | $41,606 |
| Median | $48,754 | $41,078 |
| Interquartile 25% (IQ1) | $42,787 | $36,652 |
| Interquartile 75% (IQ3) | $57,558 | $44,886 |
| Interquartile Range (IQR) | $14,771 | $8,234 |
| Standard Deviation (Sample) | $11,764 | $9,677 |
| Standard Deviation (Population) | $11,664 | $9,602 |
Similar Demographics by Median Female Earnings
Demographics Similar to Immigrants from Korea by Median Female Earnings
In terms of median female earnings, the demographic groups most similar to Immigrants from Korea are Burmese ($44,911, a difference of 0.14%), Immigrants from Sweden ($44,774, a difference of 0.16%), Immigrants from Belarus ($44,757, a difference of 0.20%), Immigrants from Greece ($44,976, a difference of 0.29%), and Turkish ($44,695, a difference of 0.34%).
| Demographics | Rating | Rank | Median Female Earnings |
| Immigrants | South Central Asia | 100.0 /100 | #17 | Exceptional $46,324 |
| Cypriots | 100.0 /100 | #18 | Exceptional $45,570 |
| Eastern Europeans | 100.0 /100 | #19 | Exceptional $45,385 |
| Immigrants | Japan | 100.0 /100 | #20 | Exceptional $45,323 |
| Cambodians | 100.0 /100 | #21 | Exceptional $45,014 |
| Immigrants | Greece | 100.0 /100 | #22 | Exceptional $44,976 |
| Burmese | 100.0 /100 | #23 | Exceptional $44,911 |
| Immigrants | Korea | 100.0 /100 | #24 | Exceptional $44,847 |
| Immigrants | Sweden | 100.0 /100 | #25 | Exceptional $44,774 |
| Immigrants | Belarus | 100.0 /100 | #26 | Exceptional $44,757 |
| Turks | 100.0 /100 | #27 | Exceptional $44,695 |
| Immigrants | Russia | 100.0 /100 | #28 | Exceptional $44,680 |
| Immigrants | Belgium | 100.0 /100 | #29 | Exceptional $44,587 |
| Asians | 100.0 /100 | #30 | Exceptional $44,586 |
| Immigrants | France | 100.0 /100 | #31 | Exceptional $44,541 |
Demographics Similar to Palestinians by Median Female Earnings
In terms of median female earnings, the demographic groups most similar to Palestinians are Immigrants from Eritrea ($41,485, a difference of 0.0%), Italian ($41,505, a difference of 0.050%), Jordanian ($41,464, a difference of 0.050%), Chinese ($41,461, a difference of 0.050%), and Immigrants from Zimbabwe ($41,527, a difference of 0.10%).
| Demographics | Rating | Rank | Median Female Earnings |
| Romanians | 98.3 /100 | #100 | Exceptional $41,663 |
| Immigrants | Fiji | 98.3 /100 | #101 | Exceptional $41,656 |
| Immigrants | Poland | 98.2 /100 | #102 | Exceptional $41,630 |
| Immigrants | Argentina | 97.9 /100 | #103 | Exceptional $41,554 |
| Immigrants | Zimbabwe | 97.8 /100 | #104 | Exceptional $41,527 |
| Italians | 97.7 /100 | #105 | Exceptional $41,505 |
| Immigrants | Eritrea | 97.6 /100 | #106 | Exceptional $41,485 |
| Palestinians | 97.6 /100 | #107 | Exceptional $41,484 |
| Jordanians | 97.5 /100 | #108 | Exceptional $41,464 |
| Chinese | 97.5 /100 | #109 | Exceptional $41,461 |
| Immigrants | Western Asia | 97.0 /100 | #110 | Exceptional $41,375 |
| Immigrants | Canada | 97.0 /100 | #111 | Exceptional $41,373 |
| Immigrants | North America | 96.7 /100 | #112 | Exceptional $41,319 |
| Macedonians | 96.4 /100 | #113 | Exceptional $41,286 |
| Immigrants | England | 96.4 /100 | #114 | Exceptional $41,277 |