Immigrants from Jordan vs Immigrants from Greece 6th Grade
COMPARE
Immigrants from Jordan
Immigrants from Greece
6th Grade
6th Grade Comparison
Immigrants from Jordan
Immigrants from Greece
97.2%
6TH GRADE
73.0/ 100
METRIC RATING
152nd/ 347
METRIC RANK
97.2%
6TH GRADE
77.8/ 100
METRIC RATING
148th/ 347
METRIC RANK
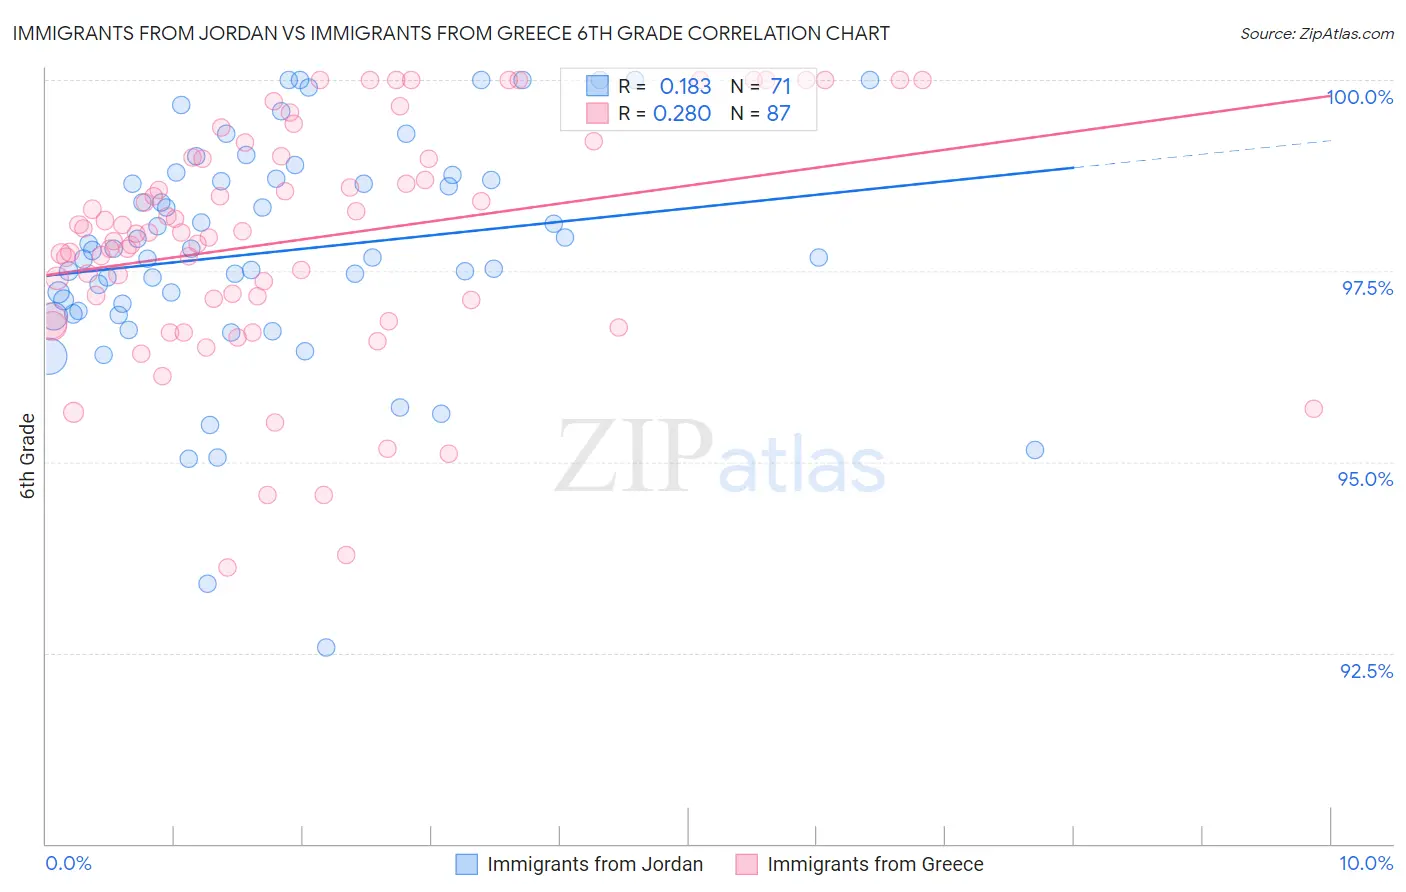
Immigrants from Jordan vs Immigrants from Greece 6th Grade Correlation Chart
The statistical analysis conducted on geographies consisting of 181,269,915 people shows a poor positive correlation between the proportion of Immigrants from Jordan and percentage of population with at least 6th grade education in the United States with a correlation coefficient (R) of 0.183 and weighted average of 97.2%. Similarly, the statistical analysis conducted on geographies consisting of 216,879,847 people shows a weak positive correlation between the proportion of Immigrants from Greece and percentage of population with at least 6th grade education in the United States with a correlation coefficient (R) of 0.280 and weighted average of 97.2%, a difference of 0.030%.
6th Grade Correlation Summary
| Measurement | Immigrants from Jordan | Immigrants from Greece |
| Minimum | 92.6% | 93.6% |
| Maximum | 100.0% | 100.0% |
| Range | 7.4% | 6.4% |
| Mean | 97.8% | 97.9% |
| Median | 97.8% | 98.0% |
| Interquartile 25% (IQ1) | 97.0% | 97.1% |
| Interquartile 75% (IQ3) | 98.7% | 99.0% |
| Interquartile Range (IQR) | 1.7% | 1.9% |
| Standard Deviation (Sample) | 1.5% | 1.5% |
| Standard Deviation (Population) | 1.5% | 1.5% |
Demographics Similar to Immigrants from Jordan and Immigrants from Greece by 6th Grade
In terms of 6th grade, the demographic groups most similar to Immigrants from Jordan are Immigrants from Eastern Europe (97.2%, a difference of 0.0%), Immigrants from Bosnia and Herzegovina (97.2%, a difference of 0.010%), French American Indian (97.2%, a difference of 0.010%), Soviet Union (97.2%, a difference of 0.010%), and Ute (97.1%, a difference of 0.010%). Similarly, the demographic groups most similar to Immigrants from Greece are Immigrants from South Central Asia (97.2%, a difference of 0.0%), Hopi (97.2%, a difference of 0.010%), Immigrants from Israel (97.2%, a difference of 0.010%), Spaniard (97.2%, a difference of 0.020%), and Immigrants from Bosnia and Herzegovina (97.2%, a difference of 0.020%).
| Demographics | Rating | Rank | 6th Grade |
| Immigrants | North Macedonia | 85.5 /100 | #140 | Excellent 97.2% |
| Seminole | 84.8 /100 | #141 | Excellent 97.2% |
| Jordanians | 84.6 /100 | #142 | Excellent 97.2% |
| Pima | 82.9 /100 | #143 | Excellent 97.2% |
| Israelis | 82.9 /100 | #144 | Excellent 97.2% |
| Spaniards | 80.1 /100 | #145 | Excellent 97.2% |
| Hopi | 78.8 /100 | #146 | Good 97.2% |
| Immigrants | South Central Asia | 78.1 /100 | #147 | Good 97.2% |
| Immigrants | Greece | 77.8 /100 | #148 | Good 97.2% |
| Immigrants | Israel | 76.0 /100 | #149 | Good 97.2% |
| Immigrants | Bosnia and Herzegovina | 74.8 /100 | #150 | Good 97.2% |
| French American Indians | 74.0 /100 | #151 | Good 97.2% |
| Immigrants | Jordan | 73.0 /100 | #152 | Good 97.2% |
| Immigrants | Eastern Europe | 72.6 /100 | #153 | Good 97.2% |
| Soviet Union | 71.5 /100 | #154 | Good 97.2% |
| Ute | 71.1 /100 | #155 | Good 97.1% |
| Alsatians | 69.8 /100 | #156 | Good 97.1% |
| Immigrants | Russia | 67.6 /100 | #157 | Good 97.1% |
| Immigrants | Iran | 63.3 /100 | #158 | Good 97.1% |
| Kenyans | 62.9 /100 | #159 | Good 97.1% |
| Ugandans | 62.2 /100 | #160 | Good 97.1% |