Immigrants from Jordan vs Immigrants from Sri Lanka 6th Grade
COMPARE
Immigrants from Jordan
Immigrants from Sri Lanka
6th Grade
6th Grade Comparison
Immigrants from Jordan
Immigrants from Sri Lanka
97.2%
6TH GRADE
73.0/ 100
METRIC RATING
152nd/ 347
METRIC RANK
97.1%
6TH GRADE
51.7/ 100
METRIC RATING
171st/ 347
METRIC RANK
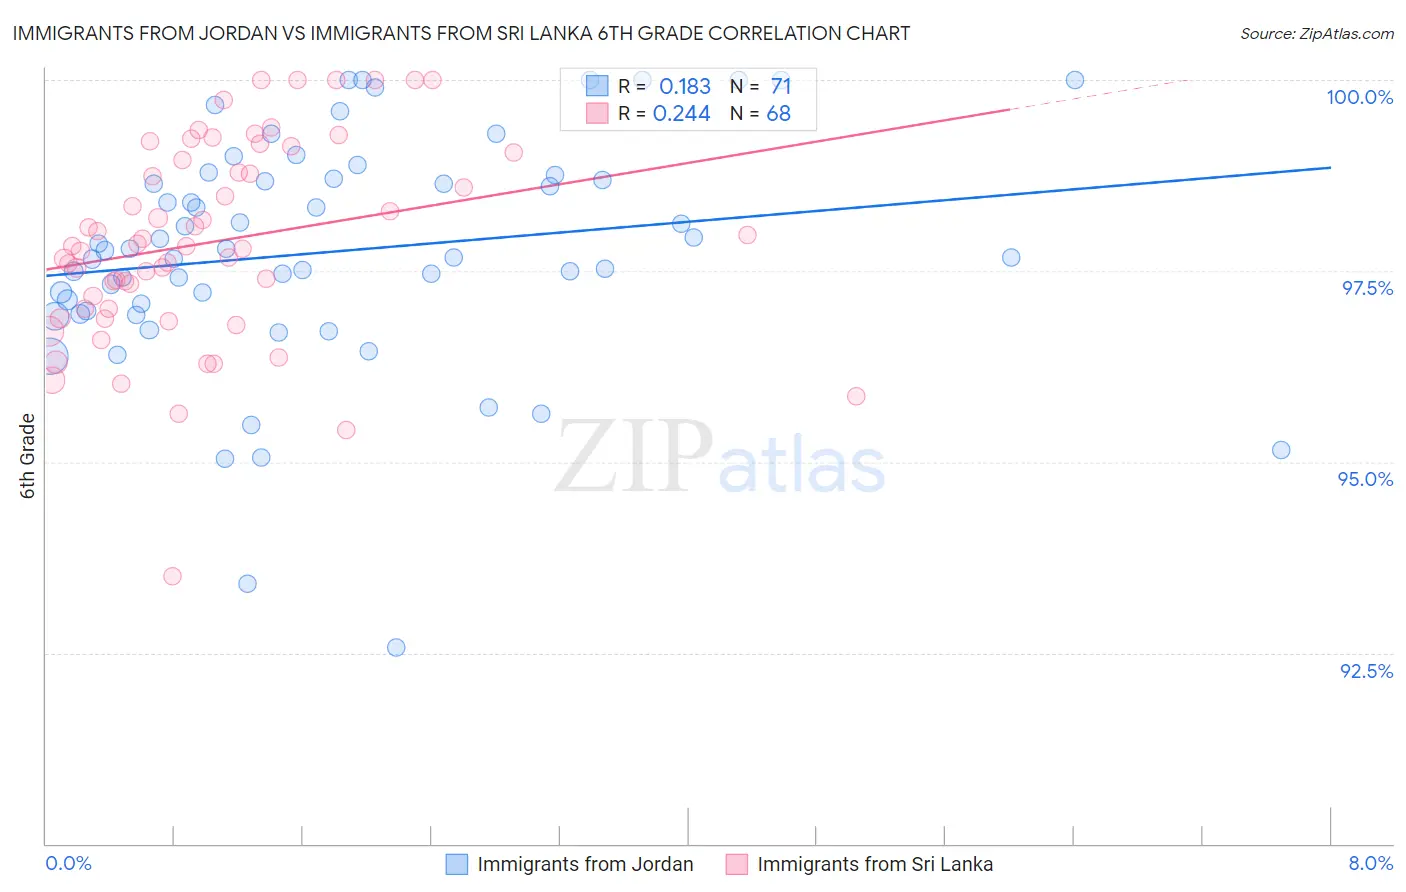
Immigrants from Jordan vs Immigrants from Sri Lanka 6th Grade Correlation Chart
The statistical analysis conducted on geographies consisting of 181,269,915 people shows a poor positive correlation between the proportion of Immigrants from Jordan and percentage of population with at least 6th grade education in the United States with a correlation coefficient (R) of 0.183 and weighted average of 97.2%. Similarly, the statistical analysis conducted on geographies consisting of 149,673,469 people shows a weak positive correlation between the proportion of Immigrants from Sri Lanka and percentage of population with at least 6th grade education in the United States with a correlation coefficient (R) of 0.244 and weighted average of 97.1%, a difference of 0.11%.
6th Grade Correlation Summary
| Measurement | Immigrants from Jordan | Immigrants from Sri Lanka |
| Minimum | 92.6% | 93.5% |
| Maximum | 100.0% | 100.0% |
| Range | 7.4% | 6.5% |
| Mean | 97.8% | 97.9% |
| Median | 97.8% | 97.8% |
| Interquartile 25% (IQ1) | 97.0% | 97.0% |
| Interquartile 75% (IQ3) | 98.7% | 99.0% |
| Interquartile Range (IQR) | 1.7% | 2.0% |
| Standard Deviation (Sample) | 1.5% | 1.3% |
| Standard Deviation (Population) | 1.5% | 1.3% |
Demographics Similar to Immigrants from Jordan and Immigrants from Sri Lanka by 6th Grade
In terms of 6th grade, the demographic groups most similar to Immigrants from Jordan are Immigrants from Eastern Europe (97.2%, a difference of 0.0%), French American Indian (97.2%, a difference of 0.010%), Soviet Union (97.2%, a difference of 0.010%), Ute (97.1%, a difference of 0.010%), and Alsatian (97.1%, a difference of 0.020%). Similarly, the demographic groups most similar to Immigrants from Sri Lanka are Bermudan (97.1%, a difference of 0.0%), Chilean (97.1%, a difference of 0.0%), Immigrants from Italy (97.1%, a difference of 0.010%), Apache (97.1%, a difference of 0.010%), and Immigrants from Taiwan (97.1%, a difference of 0.010%).
| Demographics | Rating | Rank | 6th Grade |
| French American Indians | 74.0 /100 | #151 | Good 97.2% |
| Immigrants | Jordan | 73.0 /100 | #152 | Good 97.2% |
| Immigrants | Eastern Europe | 72.6 /100 | #153 | Good 97.2% |
| Soviet Union | 71.5 /100 | #154 | Good 97.2% |
| Ute | 71.1 /100 | #155 | Good 97.1% |
| Alsatians | 69.8 /100 | #156 | Good 97.1% |
| Immigrants | Russia | 67.6 /100 | #157 | Good 97.1% |
| Immigrants | Iran | 63.3 /100 | #158 | Good 97.1% |
| Kenyans | 62.9 /100 | #159 | Good 97.1% |
| Ugandans | 62.2 /100 | #160 | Good 97.1% |
| Immigrants | Belarus | 60.4 /100 | #161 | Good 97.1% |
| Marshallese | 60.2 /100 | #162 | Good 97.1% |
| Albanians | 57.8 /100 | #163 | Average 97.1% |
| Immigrants | Korea | 57.7 /100 | #164 | Average 97.1% |
| Immigrants | Poland | 56.2 /100 | #165 | Average 97.1% |
| Immigrants | Italy | 53.8 /100 | #166 | Average 97.1% |
| Apache | 53.6 /100 | #167 | Average 97.1% |
| Immigrants | Taiwan | 53.5 /100 | #168 | Average 97.1% |
| Bermudans | 52.6 /100 | #169 | Average 97.1% |
| Chileans | 52.1 /100 | #170 | Average 97.1% |
| Immigrants | Sri Lanka | 51.7 /100 | #171 | Average 97.1% |