Immigrants from Japan vs Scotch-Irish In Labor Force | Age 25-29
COMPARE
Immigrants from Japan
Scotch-Irish
In Labor Force | Age 25-29
In Labor Force | Age 25-29 Comparison
Immigrants from Japan
Scotch-Irish
85.1%
IN LABOR FORCE | AGE 25-29
93.5/ 100
METRIC RATING
103rd/ 347
METRIC RANK
84.2%
IN LABOR FORCE | AGE 25-29
6.5/ 100
METRIC RATING
223rd/ 347
METRIC RANK
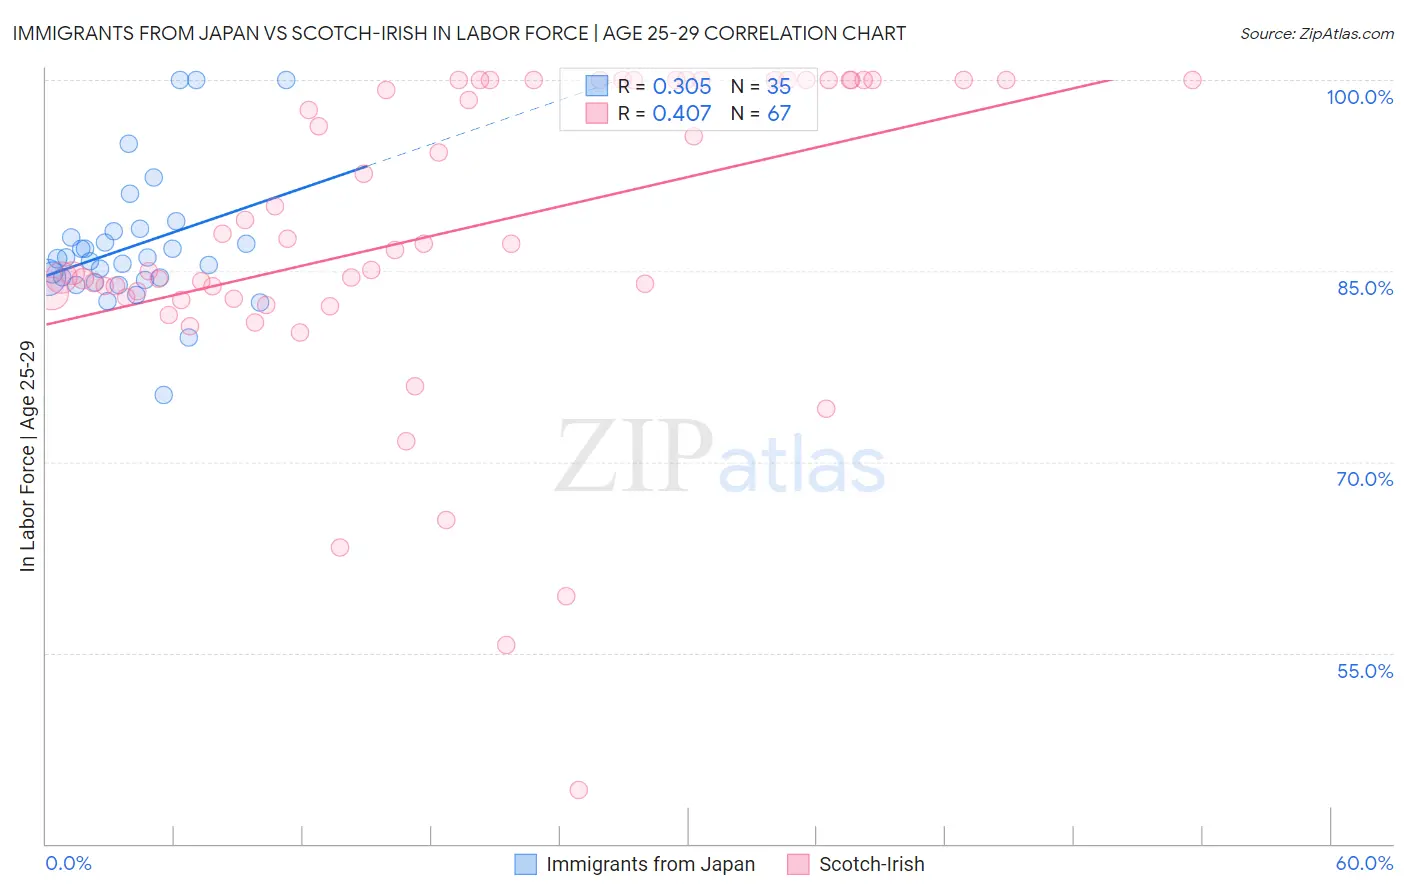
Immigrants from Japan vs Scotch-Irish In Labor Force | Age 25-29 Correlation Chart
The statistical analysis conducted on geographies consisting of 340,047,013 people shows a mild positive correlation between the proportion of Immigrants from Japan and labor force participation rate among population between the ages 25 and 29 in the United States with a correlation coefficient (R) of 0.305 and weighted average of 85.1%. Similarly, the statistical analysis conducted on geographies consisting of 547,797,884 people shows a moderate positive correlation between the proportion of Scotch-Irish and labor force participation rate among population between the ages 25 and 29 in the United States with a correlation coefficient (R) of 0.407 and weighted average of 84.2%, a difference of 0.99%.
In Labor Force | Age 25-29 Correlation Summary
| Measurement | Immigrants from Japan | Scotch-Irish |
| Minimum | 75.2% | 44.2% |
| Maximum | 100.0% | 100.0% |
| Range | 24.8% | 55.8% |
| Mean | 87.0% | 88.0% |
| Median | 85.9% | 87.1% |
| Interquartile 25% (IQ1) | 84.3% | 82.9% |
| Interquartile 75% (IQ3) | 88.1% | 100.0% |
| Interquartile Range (IQR) | 3.8% | 17.1% |
| Standard Deviation (Sample) | 5.3% | 12.1% |
| Standard Deviation (Population) | 5.2% | 12.0% |
Similar Demographics by In Labor Force | Age 25-29
Demographics Similar to Immigrants from Japan by In Labor Force | Age 25-29
In terms of in labor force | age 25-29, the demographic groups most similar to Immigrants from Japan are Bangladeshi (85.1%, a difference of 0.010%), Immigrants from Switzerland (85.1%, a difference of 0.010%), Egyptian (85.1%, a difference of 0.010%), Slavic (85.1%, a difference of 0.010%), and Immigrants from Zaire (85.1%, a difference of 0.010%).
| Demographics | Rating | Rank | In Labor Force | Age 25-29 |
| Immigrants | Romania | 94.6 /100 | #96 | Exceptional 85.1% |
| Immigrants | Sudan | 94.3 /100 | #97 | Exceptional 85.1% |
| Mongolians | 94.1 /100 | #98 | Exceptional 85.1% |
| Bangladeshis | 94.0 /100 | #99 | Exceptional 85.1% |
| Immigrants | Switzerland | 93.9 /100 | #100 | Exceptional 85.1% |
| Egyptians | 93.8 /100 | #101 | Exceptional 85.1% |
| Slavs | 93.7 /100 | #102 | Exceptional 85.1% |
| Immigrants | Japan | 93.5 /100 | #103 | Exceptional 85.1% |
| Immigrants | Zaire | 93.3 /100 | #104 | Exceptional 85.1% |
| Immigrants | Hong Kong | 92.8 /100 | #105 | Exceptional 85.0% |
| Czechoslovakians | 92.6 /100 | #106 | Exceptional 85.0% |
| Immigrants | Southern Europe | 92.3 /100 | #107 | Exceptional 85.0% |
| Immigrants | Austria | 91.9 /100 | #108 | Exceptional 85.0% |
| Costa Ricans | 91.9 /100 | #109 | Exceptional 85.0% |
| New Zealanders | 91.5 /100 | #110 | Exceptional 85.0% |
Demographics Similar to Scotch-Irish by In Labor Force | Age 25-29
In terms of in labor force | age 25-29, the demographic groups most similar to Scotch-Irish are Arab (84.2%, a difference of 0.010%), Jordanian (84.2%, a difference of 0.010%), Immigrants from West Indies (84.2%, a difference of 0.010%), Nigerian (84.3%, a difference of 0.020%), and Korean (84.2%, a difference of 0.020%).
| Demographics | Rating | Rank | In Labor Force | Age 25-29 |
| Israelis | 9.3 /100 | #216 | Tragic 84.3% |
| Immigrants | Ecuador | 9.3 /100 | #217 | Tragic 84.3% |
| Immigrants | Nigeria | 9.0 /100 | #218 | Tragic 84.3% |
| Immigrants | Saudi Arabia | 8.8 /100 | #219 | Tragic 84.3% |
| Nigerians | 7.2 /100 | #220 | Tragic 84.3% |
| Arabs | 6.8 /100 | #221 | Tragic 84.2% |
| Jordanians | 6.7 /100 | #222 | Tragic 84.2% |
| Scotch-Irish | 6.5 /100 | #223 | Tragic 84.2% |
| Immigrants | West Indies | 6.0 /100 | #224 | Tragic 84.2% |
| Koreans | 5.9 /100 | #225 | Tragic 84.2% |
| Immigrants | Congo | 5.8 /100 | #226 | Tragic 84.2% |
| French American Indians | 5.5 /100 | #227 | Tragic 84.2% |
| Immigrants | Panama | 5.5 /100 | #228 | Tragic 84.2% |
| Immigrants | Oceania | 5.0 /100 | #229 | Tragic 84.2% |
| Whites/Caucasians | 4.8 /100 | #230 | Tragic 84.2% |