Immigrants from Norway vs Scotch-Irish GED/Equivalency
COMPARE
Immigrants from Norway
Scotch-Irish
GED/Equivalency
GED/Equivalency Comparison
Immigrants from Norway
Scotch-Irish
87.5%
GED/EQUIVALENCY
98.1/ 100
METRIC RATING
88th/ 347
METRIC RANK
86.8%
GED/EQUIVALENCY
91.6/ 100
METRIC RATING
120th/ 347
METRIC RANK
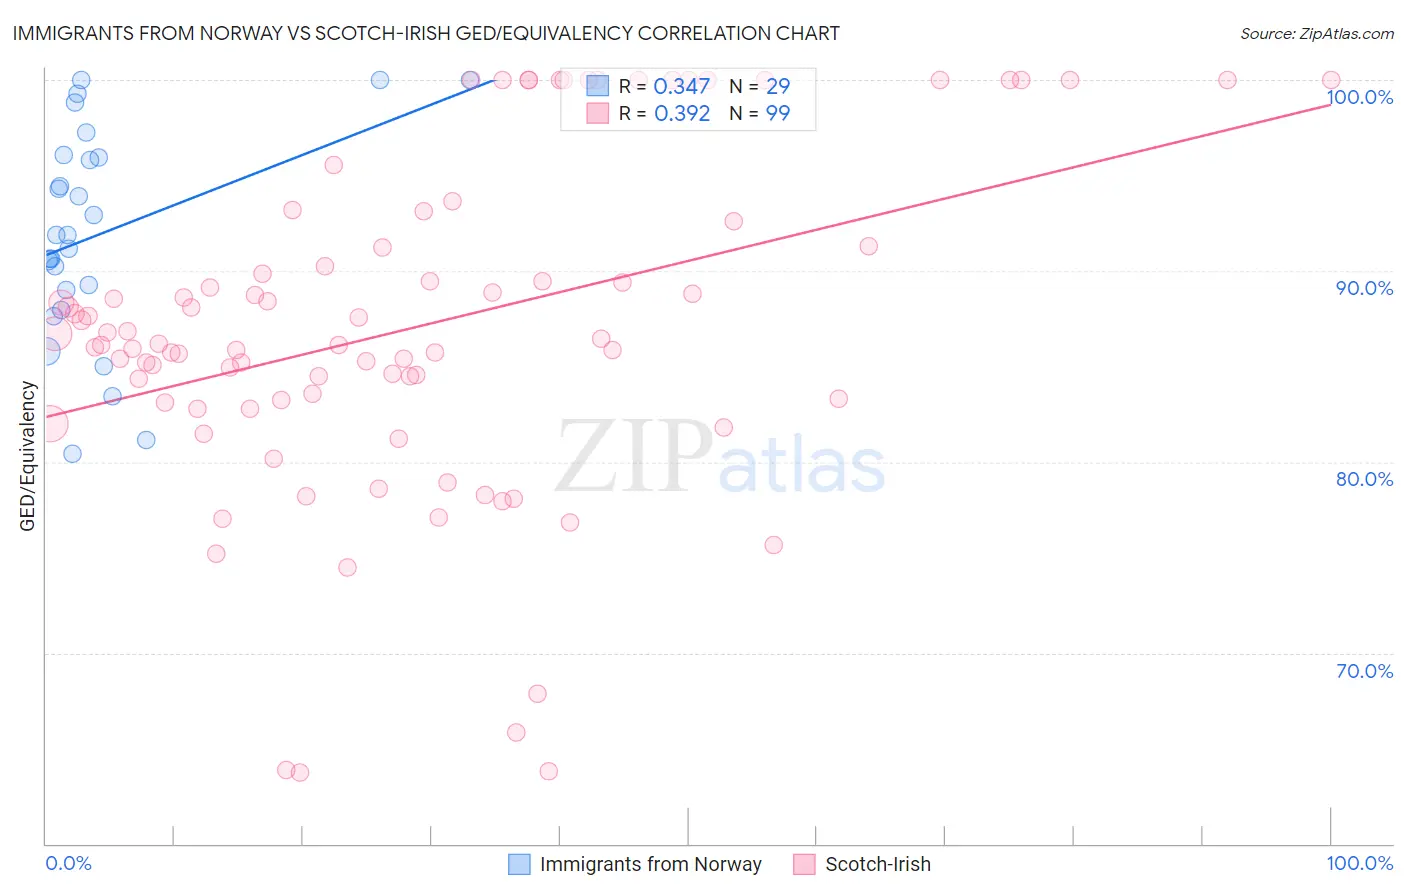
Immigrants from Norway vs Scotch-Irish GED/Equivalency Correlation Chart
The statistical analysis conducted on geographies consisting of 116,716,420 people shows a mild positive correlation between the proportion of Immigrants from Norway and percentage of population with at least ged/equivalency education in the United States with a correlation coefficient (R) of 0.347 and weighted average of 87.5%. Similarly, the statistical analysis conducted on geographies consisting of 548,780,564 people shows a mild positive correlation between the proportion of Scotch-Irish and percentage of population with at least ged/equivalency education in the United States with a correlation coefficient (R) of 0.392 and weighted average of 86.8%, a difference of 0.78%.
GED/Equivalency Correlation Summary
| Measurement | Immigrants from Norway | Scotch-Irish |
| Minimum | 80.4% | 63.7% |
| Maximum | 100.0% | 100.0% |
| Range | 19.6% | 36.3% |
| Mean | 91.9% | 87.0% |
| Median | 91.9% | 86.2% |
| Interquartile 25% (IQ1) | 88.5% | 83.1% |
| Interquartile 75% (IQ3) | 96.0% | 91.3% |
| Interquartile Range (IQR) | 7.6% | 8.2% |
| Standard Deviation (Sample) | 5.5% | 8.7% |
| Standard Deviation (Population) | 5.4% | 8.7% |
Similar Demographics by GED/Equivalency
Demographics Similar to Immigrants from Norway by GED/Equivalency
In terms of ged/equivalency, the demographic groups most similar to Immigrants from Norway are Immigrants from Europe (87.5%, a difference of 0.010%), Native Hawaiian (87.5%, a difference of 0.010%), Immigrants from Romania (87.5%, a difference of 0.020%), Dutch (87.5%, a difference of 0.020%), and Hungarian (87.4%, a difference of 0.040%).
| Demographics | Rating | Rank | GED/Equivalency |
| Immigrants | Sri Lanka | 98.3 /100 | #81 | Exceptional 87.5% |
| Romanians | 98.3 /100 | #82 | Exceptional 87.5% |
| South Africans | 98.3 /100 | #83 | Exceptional 87.5% |
| Immigrants | Romania | 98.1 /100 | #84 | Exceptional 87.5% |
| Dutch | 98.1 /100 | #85 | Exceptional 87.5% |
| Immigrants | Europe | 98.1 /100 | #86 | Exceptional 87.5% |
| Native Hawaiians | 98.1 /100 | #87 | Exceptional 87.5% |
| Immigrants | Norway | 98.1 /100 | #88 | Exceptional 87.5% |
| Hungarians | 97.9 /100 | #89 | Exceptional 87.4% |
| Welsh | 97.9 /100 | #90 | Exceptional 87.4% |
| Immigrants | Eastern Asia | 97.9 /100 | #91 | Exceptional 87.4% |
| Israelis | 97.8 /100 | #92 | Exceptional 87.4% |
| Immigrants | North Macedonia | 97.8 /100 | #93 | Exceptional 87.4% |
| Immigrants | Russia | 97.8 /100 | #94 | Exceptional 87.4% |
| Immigrants | Greece | 97.7 /100 | #95 | Exceptional 87.4% |
Demographics Similar to Scotch-Irish by GED/Equivalency
In terms of ged/equivalency, the demographic groups most similar to Scotch-Irish are Immigrants from Lebanon (86.8%, a difference of 0.050%), Immigrants from Jordan (86.8%, a difference of 0.050%), Immigrants from Italy (86.7%, a difference of 0.070%), Immigrants from Egypt (86.7%, a difference of 0.080%), and Celtic (86.7%, a difference of 0.080%).
| Demographics | Rating | Rank | GED/Equivalency |
| Assyrians/Chaldeans/Syriacs | 94.8 /100 | #113 | Exceptional 87.0% |
| Immigrants | Kazakhstan | 94.7 /100 | #114 | Exceptional 87.0% |
| Mongolians | 94.6 /100 | #115 | Exceptional 87.0% |
| Swiss | 94.5 /100 | #116 | Exceptional 87.0% |
| Immigrants | Hong Kong | 93.8 /100 | #117 | Exceptional 86.9% |
| French Canadians | 93.2 /100 | #118 | Exceptional 86.9% |
| Immigrants | China | 93.2 /100 | #119 | Exceptional 86.9% |
| Scotch-Irish | 91.6 /100 | #120 | Exceptional 86.8% |
| Immigrants | Lebanon | 90.9 /100 | #121 | Exceptional 86.8% |
| Immigrants | Jordan | 90.8 /100 | #122 | Exceptional 86.8% |
| Immigrants | Italy | 90.5 /100 | #123 | Exceptional 86.7% |
| Immigrants | Egypt | 90.4 /100 | #124 | Exceptional 86.7% |
| Celtics | 90.4 /100 | #125 | Exceptional 86.7% |
| Asians | 90.3 /100 | #126 | Exceptional 86.7% |
| Argentineans | 89.7 /100 | #127 | Excellent 86.7% |