Immigrants from England vs Japanese Associate's Degree
COMPARE
Immigrants from England
Japanese
Associate's Degree
Associate's Degree Comparison
Immigrants from England
Japanese
49.7%
ASSOCIATE'S DEGREE
98.0/ 100
METRIC RATING
95th/ 347
METRIC RANK
41.7%
ASSOCIATE'S DEGREE
0.5/ 100
METRIC RATING
258th/ 347
METRIC RANK
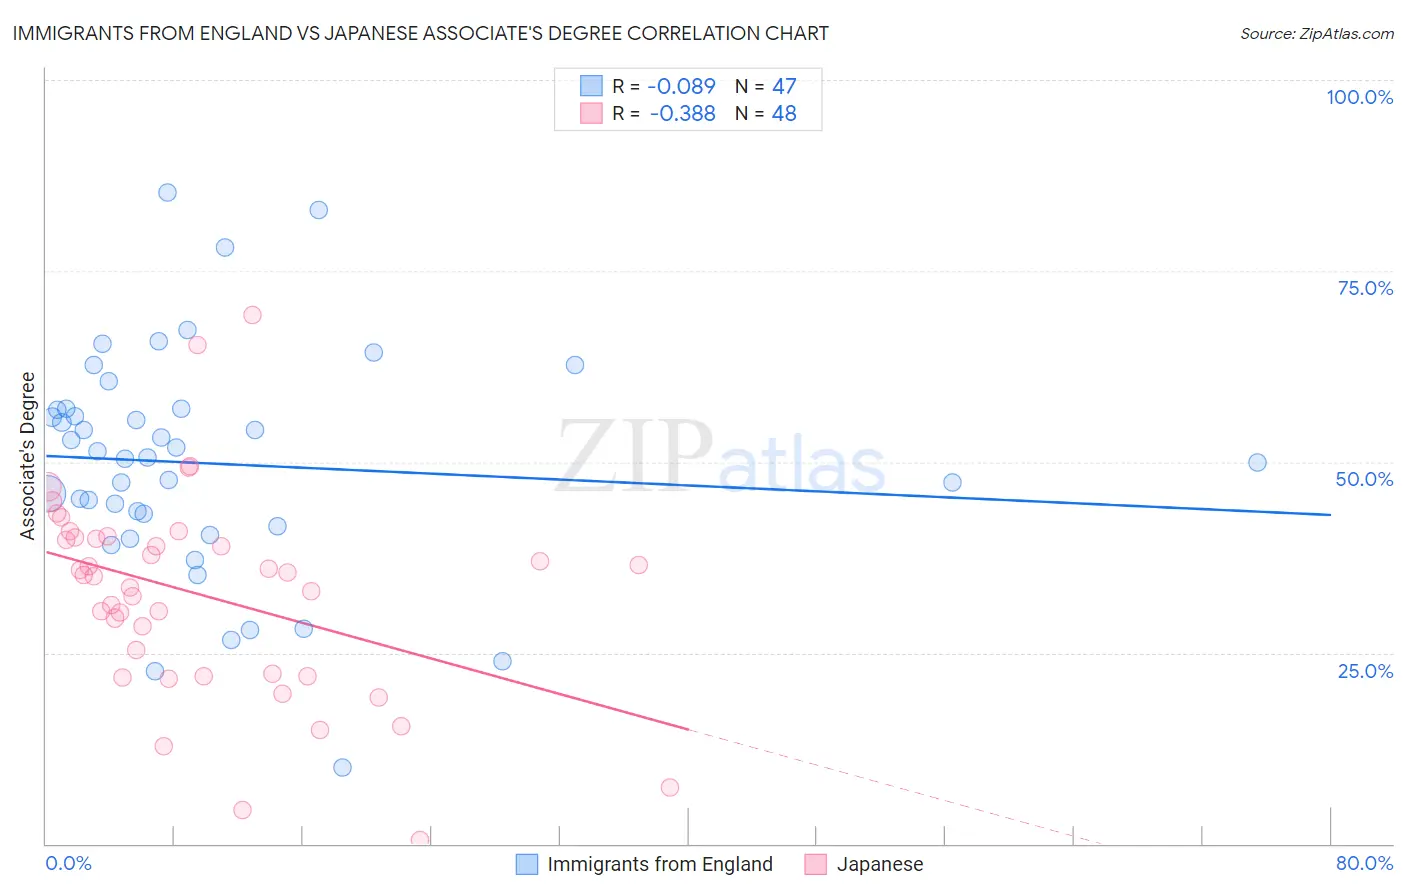
Immigrants from England vs Japanese Associate's Degree Correlation Chart
The statistical analysis conducted on geographies consisting of 391,885,412 people shows a slight negative correlation between the proportion of Immigrants from England and percentage of population with at least associate's degree education in the United States with a correlation coefficient (R) of -0.089 and weighted average of 49.7%. Similarly, the statistical analysis conducted on geographies consisting of 249,174,886 people shows a mild negative correlation between the proportion of Japanese and percentage of population with at least associate's degree education in the United States with a correlation coefficient (R) of -0.388 and weighted average of 41.7%, a difference of 19.3%.
Associate's Degree Correlation Summary
| Measurement | Immigrants from England | Japanese |
| Minimum | 10.0% | 0.50% |
| Maximum | 85.3% | 69.2% |
| Range | 75.3% | 68.7% |
| Mean | 49.8% | 32.6% |
| Median | 50.6% | 35.1% |
| Interquartile 25% (IQ1) | 41.6% | 22.1% |
| Interquartile 75% (IQ3) | 56.9% | 40.0% |
| Interquartile Range (IQR) | 15.3% | 17.9% |
| Standard Deviation (Sample) | 15.0% | 13.5% |
| Standard Deviation (Population) | 14.9% | 13.4% |
Similar Demographics by Associate's Degree
Demographics Similar to Immigrants from England by Associate's Degree
In terms of associate's degree, the demographic groups most similar to Immigrants from England are Romanian (49.7%, a difference of 0.010%), Immigrants from Ukraine (49.7%, a difference of 0.020%), Immigrants from Northern Africa (49.7%, a difference of 0.11%), Macedonian (49.6%, a difference of 0.18%), and Laotian (49.9%, a difference of 0.39%).
| Demographics | Rating | Rank | Associate's Degree |
| Immigrants | Canada | 98.7 /100 | #88 | Exceptional 50.1% |
| Immigrants | Western Europe | 98.7 /100 | #89 | Exceptional 50.1% |
| Immigrants | Ethiopia | 98.7 /100 | #90 | Exceptional 50.1% |
| Immigrants | Western Asia | 98.7 /100 | #91 | Exceptional 50.1% |
| Immigrants | North America | 98.7 /100 | #92 | Exceptional 50.1% |
| Immigrants | Brazil | 98.5 /100 | #93 | Exceptional 50.0% |
| Laotians | 98.4 /100 | #94 | Exceptional 49.9% |
| Immigrants | England | 98.0 /100 | #95 | Exceptional 49.7% |
| Romanians | 98.0 /100 | #96 | Exceptional 49.7% |
| Immigrants | Ukraine | 98.0 /100 | #97 | Exceptional 49.7% |
| Immigrants | Northern Africa | 97.9 /100 | #98 | Exceptional 49.7% |
| Macedonians | 97.8 /100 | #99 | Exceptional 49.6% |
| Immigrants | Nepal | 97.5 /100 | #100 | Exceptional 49.5% |
| Northern Europeans | 97.3 /100 | #101 | Exceptional 49.5% |
| Chileans | 97.3 /100 | #102 | Exceptional 49.4% |
Demographics Similar to Japanese by Associate's Degree
In terms of associate's degree, the demographic groups most similar to Japanese are Malaysian (41.6%, a difference of 0.10%), Spanish American (41.8%, a difference of 0.22%), Immigrants from Congo (41.8%, a difference of 0.27%), Marshallese (41.6%, a difference of 0.30%), and Immigrants from Guyana (41.8%, a difference of 0.40%).
| Demographics | Rating | Rank | Associate's Degree |
| Immigrants | Bahamas | 0.7 /100 | #251 | Tragic 42.1% |
| French American Indians | 0.6 /100 | #252 | Tragic 42.0% |
| Indonesians | 0.6 /100 | #253 | Tragic 41.9% |
| Cubans | 0.6 /100 | #254 | Tragic 41.9% |
| Immigrants | Guyana | 0.5 /100 | #255 | Tragic 41.8% |
| Immigrants | Congo | 0.5 /100 | #256 | Tragic 41.8% |
| Spanish Americans | 0.5 /100 | #257 | Tragic 41.8% |
| Japanese | 0.5 /100 | #258 | Tragic 41.7% |
| Malaysians | 0.4 /100 | #259 | Tragic 41.6% |
| Marshallese | 0.4 /100 | #260 | Tragic 41.6% |
| Nicaraguans | 0.4 /100 | #261 | Tragic 41.5% |
| Bahamians | 0.4 /100 | #262 | Tragic 41.5% |
| Immigrants | Jamaica | 0.3 /100 | #263 | Tragic 41.5% |
| Osage | 0.3 /100 | #264 | Tragic 41.5% |
| Africans | 0.2 /100 | #265 | Tragic 41.1% |