Immigrants from Honduras vs Canadian Associate's Degree
COMPARE
Immigrants from Honduras
Canadian
Associate's Degree
Associate's Degree Comparison
Immigrants from Honduras
Canadians
38.5%
ASSOCIATE'S DEGREE
0.0/ 100
METRIC RATING
305th/ 347
METRIC RANK
47.5%
ASSOCIATE'S DEGREE
79.0/ 100
METRIC RATING
145th/ 347
METRIC RANK
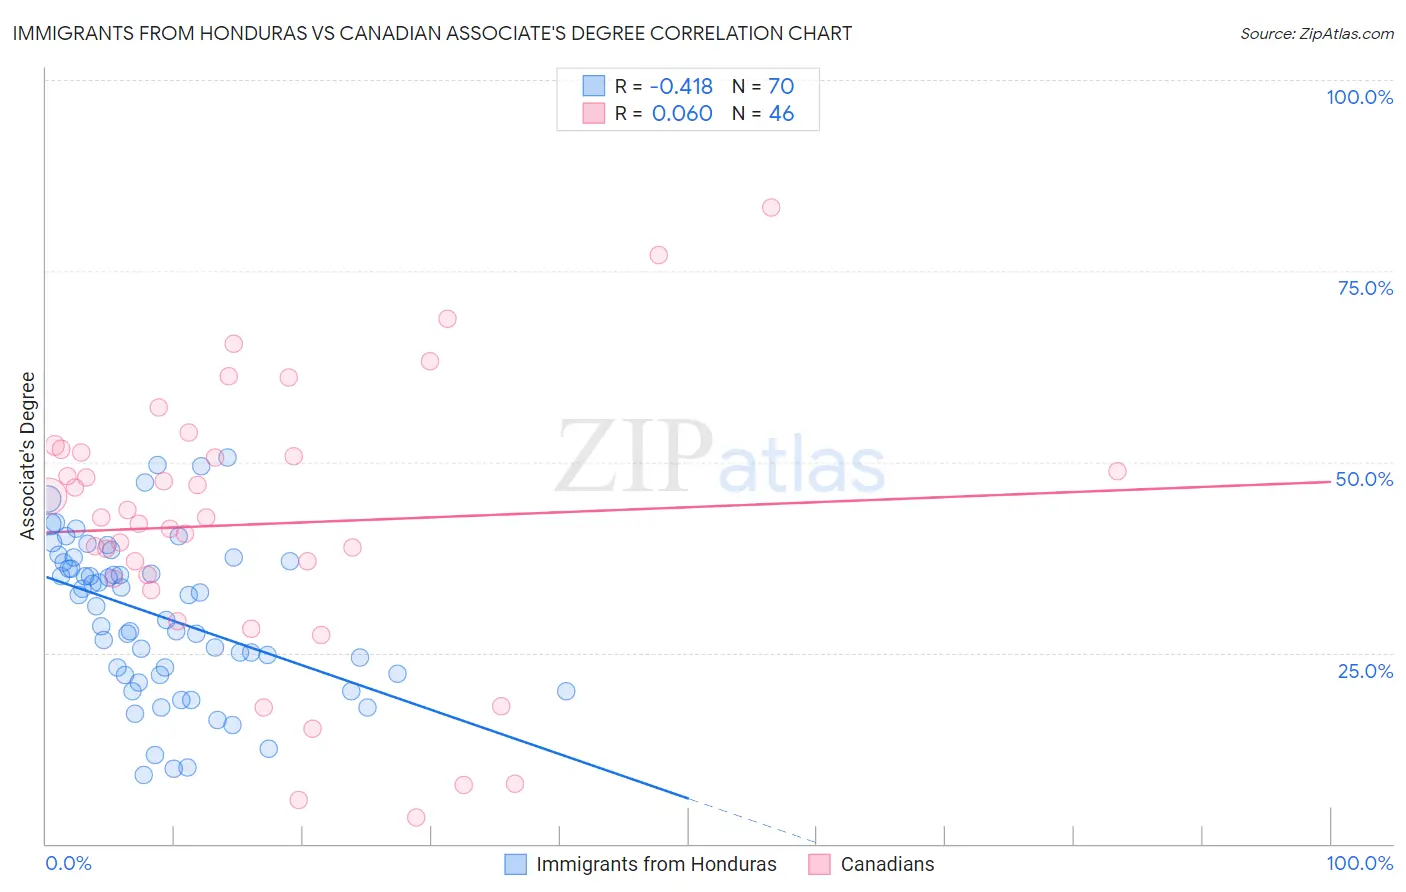
Immigrants from Honduras vs Canadian Associate's Degree Correlation Chart
The statistical analysis conducted on geographies consisting of 322,624,336 people shows a moderate negative correlation between the proportion of Immigrants from Honduras and percentage of population with at least associate's degree education in the United States with a correlation coefficient (R) of -0.418 and weighted average of 38.5%. Similarly, the statistical analysis conducted on geographies consisting of 437,535,848 people shows a slight positive correlation between the proportion of Canadians and percentage of population with at least associate's degree education in the United States with a correlation coefficient (R) of 0.060 and weighted average of 47.5%, a difference of 23.5%.
Associate's Degree Correlation Summary
| Measurement | Immigrants from Honduras | Canadian |
| Minimum | 9.0% | 3.4% |
| Maximum | 50.5% | 83.3% |
| Range | 41.5% | 80.0% |
| Mean | 29.8% | 41.8% |
| Median | 31.8% | 42.7% |
| Interquartile 25% (IQ1) | 22.0% | 34.7% |
| Interquartile 75% (IQ3) | 37.1% | 51.3% |
| Interquartile Range (IQR) | 15.0% | 16.6% |
| Standard Deviation (Sample) | 10.2% | 17.8% |
| Standard Deviation (Population) | 10.1% | 17.6% |
Similar Demographics by Associate's Degree
Demographics Similar to Immigrants from Honduras by Associate's Degree
In terms of associate's degree, the demographic groups most similar to Immigrants from Honduras are Sioux (38.5%, a difference of 0.070%), Shoshone (38.4%, a difference of 0.070%), Immigrants from El Salvador (38.4%, a difference of 0.11%), Guatemalan (38.5%, a difference of 0.12%), and Colville (38.5%, a difference of 0.21%).
| Demographics | Rating | Rank | Associate's Degree |
| Cheyenne | 0.0 /100 | #298 | Tragic 38.7% |
| Ute | 0.0 /100 | #299 | Tragic 38.6% |
| Chickasaw | 0.0 /100 | #300 | Tragic 38.6% |
| Tsimshian | 0.0 /100 | #301 | Tragic 38.6% |
| Colville | 0.0 /100 | #302 | Tragic 38.5% |
| Guatemalans | 0.0 /100 | #303 | Tragic 38.5% |
| Sioux | 0.0 /100 | #304 | Tragic 38.5% |
| Immigrants | Honduras | 0.0 /100 | #305 | Tragic 38.5% |
| Shoshone | 0.0 /100 | #306 | Tragic 38.4% |
| Immigrants | El Salvador | 0.0 /100 | #307 | Tragic 38.4% |
| Mexican American Indians | 0.0 /100 | #308 | Tragic 38.2% |
| Immigrants | Guatemala | 0.0 /100 | #309 | Tragic 38.1% |
| Immigrants | Dominican Republic | 0.0 /100 | #310 | Tragic 37.9% |
| Immigrants | Latin America | 0.0 /100 | #311 | Tragic 37.9% |
| Choctaw | 0.0 /100 | #312 | Tragic 37.8% |
Demographics Similar to Canadians by Associate's Degree
In terms of associate's degree, the demographic groups most similar to Canadians are Immigrants from Sudan (47.4%, a difference of 0.13%), Slavic (47.6%, a difference of 0.17%), Danish (47.4%, a difference of 0.18%), Norwegian (47.6%, a difference of 0.23%), and South American Indian (47.4%, a difference of 0.24%).
| Demographics | Rating | Rank | Associate's Degree |
| Poles | 87.3 /100 | #138 | Excellent 48.0% |
| Slovenes | 85.1 /100 | #139 | Excellent 47.9% |
| Immigrants | Southern Europe | 84.4 /100 | #140 | Excellent 47.8% |
| Taiwanese | 83.3 /100 | #141 | Excellent 47.7% |
| Sierra Leoneans | 82.9 /100 | #142 | Excellent 47.7% |
| Norwegians | 81.0 /100 | #143 | Excellent 47.6% |
| Slavs | 80.5 /100 | #144 | Excellent 47.6% |
| Canadians | 79.0 /100 | #145 | Good 47.5% |
| Immigrants | Sudan | 77.9 /100 | #146 | Good 47.4% |
| Danes | 77.3 /100 | #147 | Good 47.4% |
| South American Indians | 76.7 /100 | #148 | Good 47.4% |
| Immigrants | Armenia | 76.6 /100 | #149 | Good 47.4% |
| Iraqis | 76.2 /100 | #150 | Good 47.4% |
| Immigrants | North Macedonia | 76.0 /100 | #151 | Good 47.4% |
| Immigrants | Afghanistan | 74.3 /100 | #152 | Good 47.3% |