Immigrants from Honduras vs Immigrants from Hong Kong Associate's Degree
COMPARE
Immigrants from Honduras
Immigrants from Hong Kong
Associate's Degree
Associate's Degree Comparison
Immigrants from Honduras
Immigrants from Hong Kong
38.5%
ASSOCIATE'S DEGREE
0.0/ 100
METRIC RATING
305th/ 347
METRIC RANK
55.4%
ASSOCIATE'S DEGREE
100.0/ 100
METRIC RATING
14th/ 347
METRIC RANK
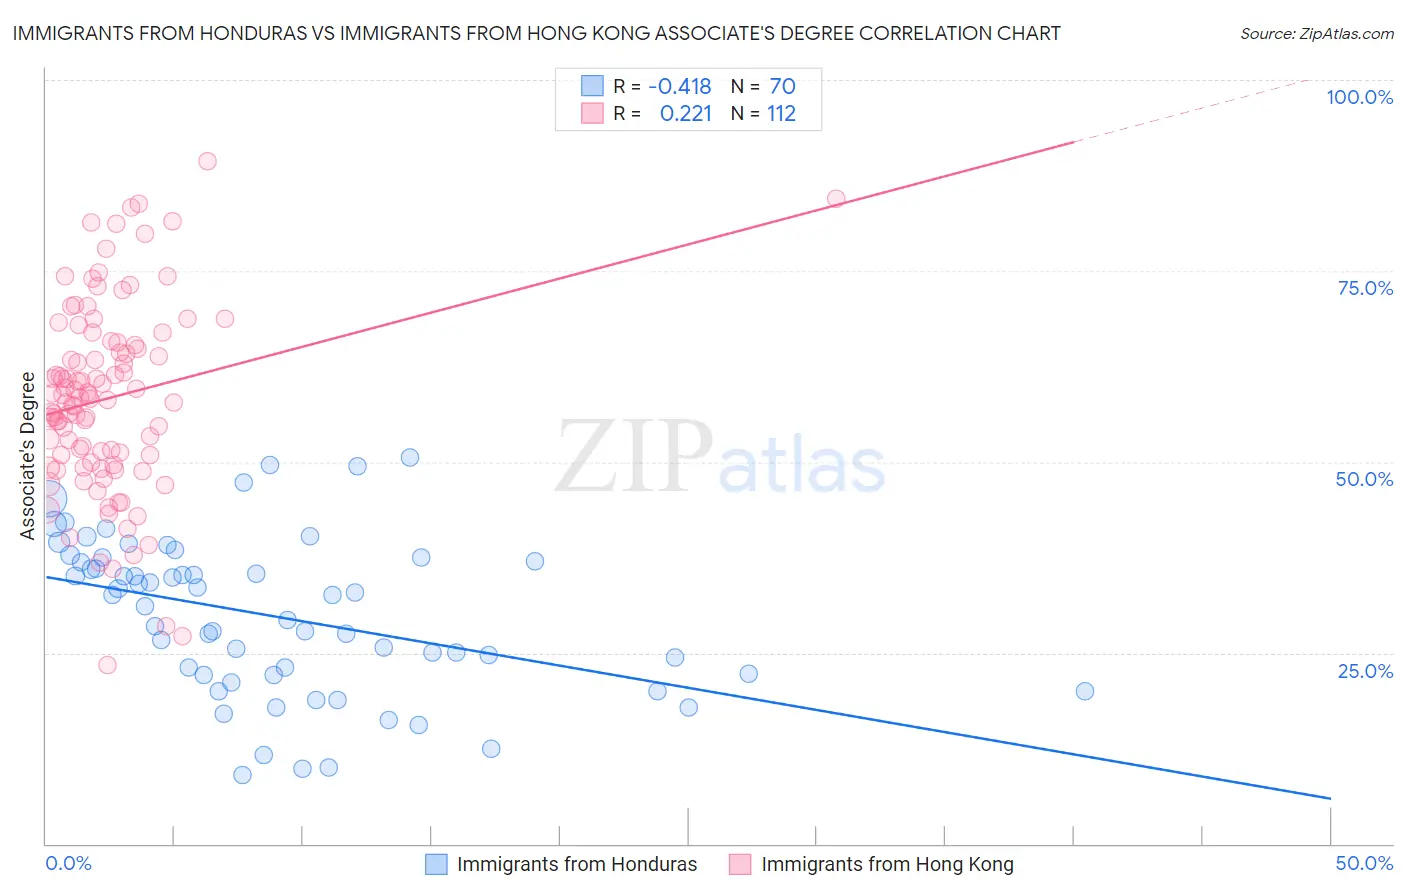
Immigrants from Honduras vs Immigrants from Hong Kong Associate's Degree Correlation Chart
The statistical analysis conducted on geographies consisting of 322,624,336 people shows a moderate negative correlation between the proportion of Immigrants from Honduras and percentage of population with at least associate's degree education in the United States with a correlation coefficient (R) of -0.418 and weighted average of 38.5%. Similarly, the statistical analysis conducted on geographies consisting of 253,990,250 people shows a weak positive correlation between the proportion of Immigrants from Hong Kong and percentage of population with at least associate's degree education in the United States with a correlation coefficient (R) of 0.221 and weighted average of 55.4%, a difference of 44.1%.
Associate's Degree Correlation Summary
| Measurement | Immigrants from Honduras | Immigrants from Hong Kong |
| Minimum | 9.0% | 23.3% |
| Maximum | 50.5% | 89.4% |
| Range | 41.5% | 66.0% |
| Mean | 29.8% | 58.3% |
| Median | 31.8% | 58.4% |
| Interquartile 25% (IQ1) | 22.0% | 50.4% |
| Interquartile 75% (IQ3) | 37.1% | 65.4% |
| Interquartile Range (IQR) | 15.0% | 15.1% |
| Standard Deviation (Sample) | 10.2% | 12.4% |
| Standard Deviation (Population) | 10.1% | 12.4% |
Similar Demographics by Associate's Degree
Demographics Similar to Immigrants from Honduras by Associate's Degree
In terms of associate's degree, the demographic groups most similar to Immigrants from Honduras are Sioux (38.5%, a difference of 0.070%), Shoshone (38.4%, a difference of 0.070%), Immigrants from El Salvador (38.4%, a difference of 0.11%), Guatemalan (38.5%, a difference of 0.12%), and Colville (38.5%, a difference of 0.21%).
| Demographics | Rating | Rank | Associate's Degree |
| Cheyenne | 0.0 /100 | #298 | Tragic 38.7% |
| Ute | 0.0 /100 | #299 | Tragic 38.6% |
| Chickasaw | 0.0 /100 | #300 | Tragic 38.6% |
| Tsimshian | 0.0 /100 | #301 | Tragic 38.6% |
| Colville | 0.0 /100 | #302 | Tragic 38.5% |
| Guatemalans | 0.0 /100 | #303 | Tragic 38.5% |
| Sioux | 0.0 /100 | #304 | Tragic 38.5% |
| Immigrants | Honduras | 0.0 /100 | #305 | Tragic 38.5% |
| Shoshone | 0.0 /100 | #306 | Tragic 38.4% |
| Immigrants | El Salvador | 0.0 /100 | #307 | Tragic 38.4% |
| Mexican American Indians | 0.0 /100 | #308 | Tragic 38.2% |
| Immigrants | Guatemala | 0.0 /100 | #309 | Tragic 38.1% |
| Immigrants | Dominican Republic | 0.0 /100 | #310 | Tragic 37.9% |
| Immigrants | Latin America | 0.0 /100 | #311 | Tragic 37.9% |
| Choctaw | 0.0 /100 | #312 | Tragic 37.8% |
Demographics Similar to Immigrants from Hong Kong by Associate's Degree
In terms of associate's degree, the demographic groups most similar to Immigrants from Hong Kong are Immigrants from Eastern Asia (55.4%, a difference of 0.030%), Immigrants from China (55.5%, a difference of 0.14%), Soviet Union (55.1%, a difference of 0.50%), Immigrants from South Central Asia (55.7%, a difference of 0.63%), and Eastern European (55.0%, a difference of 0.64%).
| Demographics | Rating | Rank | Associate's Degree |
| Immigrants | Iran | 100.0 /100 | #7 | Exceptional 57.7% |
| Thais | 100.0 /100 | #8 | Exceptional 57.4% |
| Immigrants | Israel | 100.0 /100 | #9 | Exceptional 56.8% |
| Cypriots | 100.0 /100 | #10 | Exceptional 56.4% |
| Immigrants | Australia | 100.0 /100 | #11 | Exceptional 55.8% |
| Immigrants | South Central Asia | 100.0 /100 | #12 | Exceptional 55.7% |
| Immigrants | China | 100.0 /100 | #13 | Exceptional 55.5% |
| Immigrants | Hong Kong | 100.0 /100 | #14 | Exceptional 55.4% |
| Immigrants | Eastern Asia | 100.0 /100 | #15 | Exceptional 55.4% |
| Soviet Union | 100.0 /100 | #16 | Exceptional 55.1% |
| Eastern Europeans | 100.0 /100 | #17 | Exceptional 55.0% |
| Indians (Asian) | 100.0 /100 | #18 | Exceptional 54.8% |
| Immigrants | Ireland | 100.0 /100 | #19 | Exceptional 54.7% |
| Cambodians | 100.0 /100 | #20 | Exceptional 54.6% |
| Immigrants | Sweden | 100.0 /100 | #21 | Exceptional 54.6% |