Immigrants from Guyana vs Indonesian Nursery School
COMPARE
Immigrants from Guyana
Indonesian
Nursery School
Nursery School Comparison
Immigrants from Guyana
Indonesians
96.9%
NURSERY SCHOOL
0.0/ 100
METRIC RATING
318th/ 347
METRIC RANK
96.8%
NURSERY SCHOOL
0.0/ 100
METRIC RATING
326th/ 347
METRIC RANK
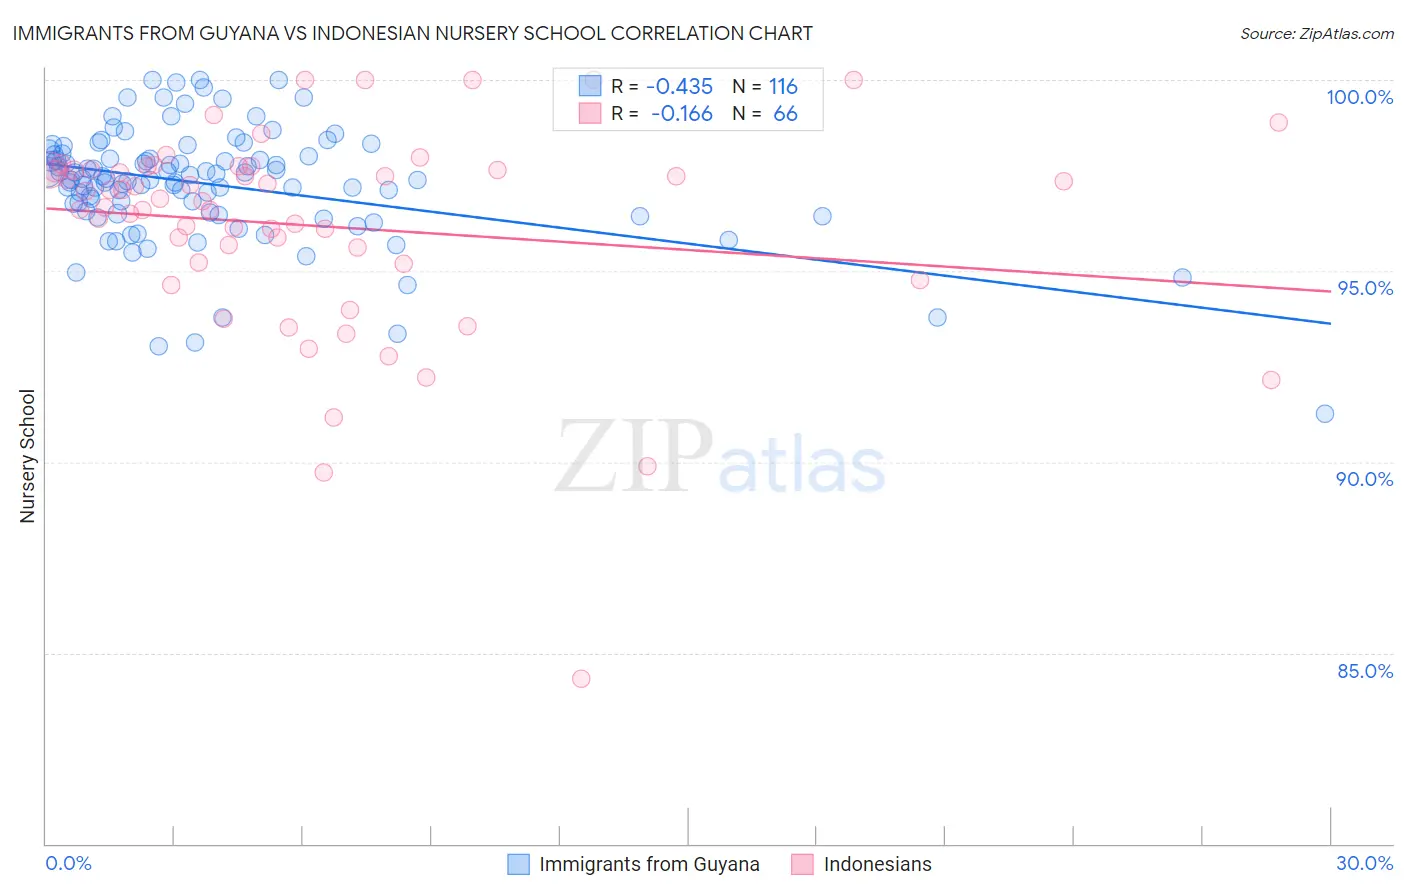
Immigrants from Guyana vs Indonesian Nursery School Correlation Chart
The statistical analysis conducted on geographies consisting of 183,746,342 people shows a moderate negative correlation between the proportion of Immigrants from Guyana and percentage of population with at least nursery school education in the United States with a correlation coefficient (R) of -0.435 and weighted average of 96.9%. Similarly, the statistical analysis conducted on geographies consisting of 162,727,113 people shows a poor negative correlation between the proportion of Indonesians and percentage of population with at least nursery school education in the United States with a correlation coefficient (R) of -0.166 and weighted average of 96.8%, a difference of 0.080%.
Nursery School Correlation Summary
| Measurement | Immigrants from Guyana | Indonesian |
| Minimum | 91.3% | 84.3% |
| Maximum | 100.0% | 100.0% |
| Range | 8.7% | 15.7% |
| Mean | 97.3% | 96.2% |
| Median | 97.4% | 96.9% |
| Interquartile 25% (IQ1) | 96.5% | 95.2% |
| Interquartile 75% (IQ3) | 98.0% | 97.7% |
| Interquartile Range (IQR) | 1.5% | 2.4% |
| Standard Deviation (Sample) | 1.5% | 2.7% |
| Standard Deviation (Population) | 1.5% | 2.7% |
Demographics Similar to Immigrants from Guyana and Indonesians by Nursery School
In terms of nursery school, the demographic groups most similar to Immigrants from Guyana are Immigrants from Laos (96.9%, a difference of 0.020%), Immigrants from Burma/Myanmar (96.9%, a difference of 0.020%), Immigrants from Bangladesh (96.9%, a difference of 0.020%), Immigrants from Ecuador (96.9%, a difference of 0.040%), and Mexican American Indian (96.9%, a difference of 0.040%). Similarly, the demographic groups most similar to Indonesians are Dominican (96.8%, a difference of 0.0%), Vietnamese (96.8%, a difference of 0.030%), Mexican American Indian (96.9%, a difference of 0.040%), Immigrants from Honduras (96.9%, a difference of 0.040%), and Immigrants from Bangladesh (96.9%, a difference of 0.060%).
| Demographics | Rating | Rank | Nursery School |
| Sri Lankans | 0.0 /100 | #312 | Tragic 97.0% |
| Hondurans | 0.0 /100 | #313 | Tragic 97.0% |
| Cape Verdeans | 0.0 /100 | #314 | Tragic 97.0% |
| Immigrants | Nicaragua | 0.0 /100 | #315 | Tragic 96.9% |
| Immigrants | Belize | 0.0 /100 | #316 | Tragic 96.9% |
| Immigrants | Ecuador | 0.0 /100 | #317 | Tragic 96.9% |
| Immigrants | Guyana | 0.0 /100 | #318 | Tragic 96.9% |
| Immigrants | Laos | 0.0 /100 | #319 | Tragic 96.9% |
| Immigrants | Burma/Myanmar | 0.0 /100 | #320 | Tragic 96.9% |
| Immigrants | Bangladesh | 0.0 /100 | #321 | Tragic 96.9% |
| Mexican American Indians | 0.0 /100 | #322 | Tragic 96.9% |
| Immigrants | Honduras | 0.0 /100 | #323 | Tragic 96.9% |
| Vietnamese | 0.0 /100 | #324 | Tragic 96.8% |
| Dominicans | 0.0 /100 | #325 | Tragic 96.8% |
| Indonesians | 0.0 /100 | #326 | Tragic 96.8% |
| Mexicans | 0.0 /100 | #327 | Tragic 96.8% |
| Immigrants | Latin America | 0.0 /100 | #328 | Tragic 96.7% |
| Immigrants | Vietnam | 0.0 /100 | #329 | Tragic 96.7% |
| Japanese | 0.0 /100 | #330 | Tragic 96.7% |
| Immigrants | Armenia | 0.0 /100 | #331 | Tragic 96.7% |
| Yakama | 0.0 /100 | #332 | Tragic 96.6% |