Immigrants from Guyana vs Immigrants from Oceania Nursery School
COMPARE
Immigrants from Guyana
Immigrants from Oceania
Nursery School
Nursery School Comparison
Immigrants from Guyana
Immigrants from Oceania
96.9%
NURSERY SCHOOL
0.0/ 100
METRIC RATING
318th/ 347
METRIC RANK
97.8%
NURSERY SCHOOL
10.2/ 100
METRIC RATING
210th/ 347
METRIC RANK
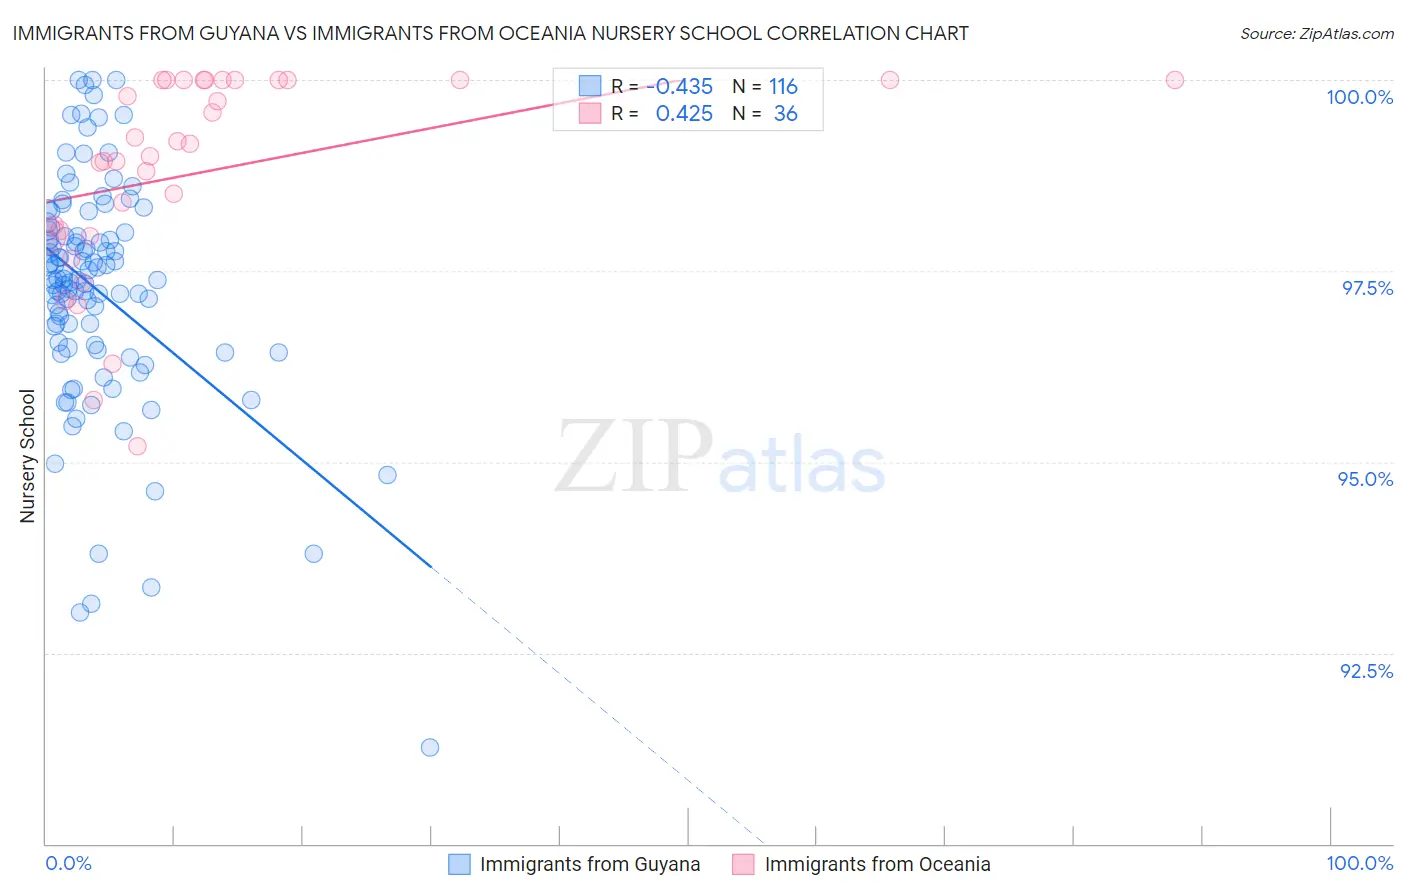
Immigrants from Guyana vs Immigrants from Oceania Nursery School Correlation Chart
The statistical analysis conducted on geographies consisting of 183,746,342 people shows a moderate negative correlation between the proportion of Immigrants from Guyana and percentage of population with at least nursery school education in the United States with a correlation coefficient (R) of -0.435 and weighted average of 96.9%. Similarly, the statistical analysis conducted on geographies consisting of 305,516,300 people shows a moderate positive correlation between the proportion of Immigrants from Oceania and percentage of population with at least nursery school education in the United States with a correlation coefficient (R) of 0.425 and weighted average of 97.8%, a difference of 0.96%.
Nursery School Correlation Summary
| Measurement | Immigrants from Guyana | Immigrants from Oceania |
| Minimum | 91.3% | 95.2% |
| Maximum | 100.0% | 100.0% |
| Range | 8.7% | 4.8% |
| Mean | 97.3% | 98.8% |
| Median | 97.4% | 99.1% |
| Interquartile 25% (IQ1) | 96.5% | 98.0% |
| Interquartile 75% (IQ3) | 98.0% | 100.0% |
| Interquartile Range (IQR) | 1.5% | 2.0% |
| Standard Deviation (Sample) | 1.5% | 1.3% |
| Standard Deviation (Population) | 1.5% | 1.3% |
Similar Demographics by Nursery School
Demographics Similar to Immigrants from Guyana by Nursery School
In terms of nursery school, the demographic groups most similar to Immigrants from Guyana are Immigrants from Laos (96.9%, a difference of 0.020%), Immigrants from Burma/Myanmar (96.9%, a difference of 0.020%), Immigrants from Bangladesh (96.9%, a difference of 0.020%), Immigrants from Ecuador (96.9%, a difference of 0.040%), and Mexican American Indian (96.9%, a difference of 0.040%).
| Demographics | Rating | Rank | Nursery School |
| Immigrants | Azores | 0.0 /100 | #311 | Tragic 97.0% |
| Sri Lankans | 0.0 /100 | #312 | Tragic 97.0% |
| Hondurans | 0.0 /100 | #313 | Tragic 97.0% |
| Cape Verdeans | 0.0 /100 | #314 | Tragic 97.0% |
| Immigrants | Nicaragua | 0.0 /100 | #315 | Tragic 96.9% |
| Immigrants | Belize | 0.0 /100 | #316 | Tragic 96.9% |
| Immigrants | Ecuador | 0.0 /100 | #317 | Tragic 96.9% |
| Immigrants | Guyana | 0.0 /100 | #318 | Tragic 96.9% |
| Immigrants | Laos | 0.0 /100 | #319 | Tragic 96.9% |
| Immigrants | Burma/Myanmar | 0.0 /100 | #320 | Tragic 96.9% |
| Immigrants | Bangladesh | 0.0 /100 | #321 | Tragic 96.9% |
| Mexican American Indians | 0.0 /100 | #322 | Tragic 96.9% |
| Immigrants | Honduras | 0.0 /100 | #323 | Tragic 96.9% |
| Vietnamese | 0.0 /100 | #324 | Tragic 96.8% |
| Dominicans | 0.0 /100 | #325 | Tragic 96.8% |
Demographics Similar to Immigrants from Oceania by Nursery School
In terms of nursery school, the demographic groups most similar to Immigrants from Oceania are Laotian (97.8%, a difference of 0.0%), Immigrants from Northern Africa (97.8%, a difference of 0.010%), Costa Rican (97.8%, a difference of 0.010%), Immigrants from Bahamas (97.8%, a difference of 0.010%), and Moroccan (97.8%, a difference of 0.020%).
| Demographics | Rating | Rank | Nursery School |
| Immigrants | Uganda | 18.0 /100 | #203 | Poor 97.9% |
| Immigrants | Southern Europe | 17.4 /100 | #204 | Poor 97.9% |
| Immigrants | Chile | 17.3 /100 | #205 | Poor 97.9% |
| Immigrants | Albania | 16.4 /100 | #206 | Poor 97.9% |
| Africans | 15.4 /100 | #207 | Poor 97.9% |
| Immigrants | Northern Africa | 11.7 /100 | #208 | Poor 97.8% |
| Costa Ricans | 11.3 /100 | #209 | Poor 97.8% |
| Immigrants | Oceania | 10.2 /100 | #210 | Poor 97.8% |
| Laotians | 9.8 /100 | #211 | Tragic 97.8% |
| Immigrants | Bahamas | 8.6 /100 | #212 | Tragic 97.8% |
| Moroccans | 8.3 /100 | #213 | Tragic 97.8% |
| South American Indians | 8.0 /100 | #214 | Tragic 97.8% |
| Bahamians | 7.4 /100 | #215 | Tragic 97.8% |
| Uruguayans | 7.1 /100 | #216 | Tragic 97.8% |
| Samoans | 6.3 /100 | #217 | Tragic 97.8% |