Immigrants from El Salvador vs Indonesian Nursery School
COMPARE
Immigrants from El Salvador
Indonesian
Nursery School
Nursery School Comparison
Immigrants from El Salvador
Indonesians
96.2%
NURSERY SCHOOL
0.0/ 100
METRIC RATING
344th/ 347
METRIC RANK
96.8%
NURSERY SCHOOL
0.0/ 100
METRIC RATING
326th/ 347
METRIC RANK
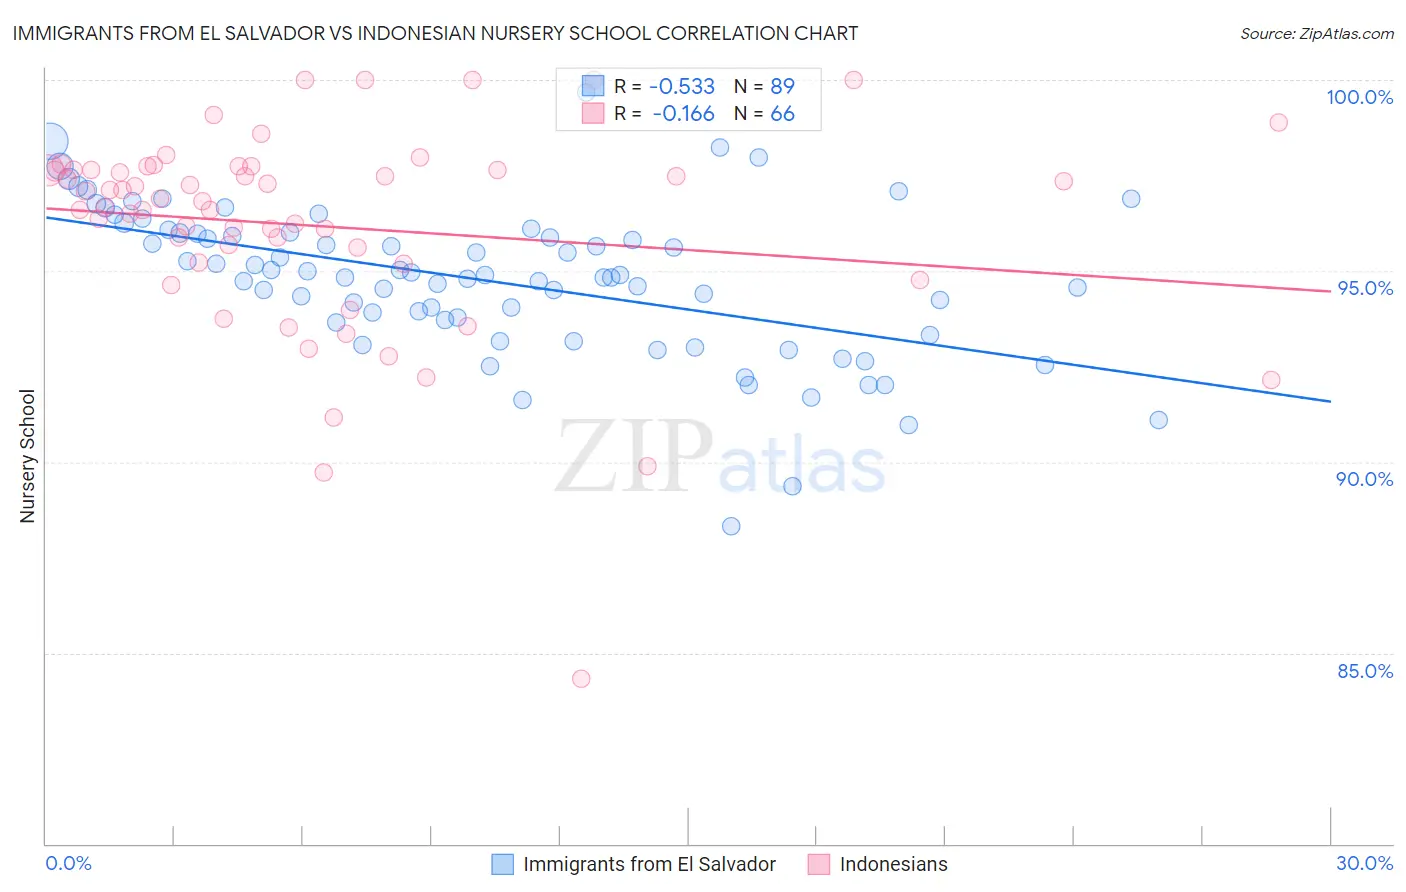
Immigrants from El Salvador vs Indonesian Nursery School Correlation Chart
The statistical analysis conducted on geographies consisting of 357,698,489 people shows a substantial negative correlation between the proportion of Immigrants from El Salvador and percentage of population with at least nursery school education in the United States with a correlation coefficient (R) of -0.533 and weighted average of 96.2%. Similarly, the statistical analysis conducted on geographies consisting of 162,727,113 people shows a poor negative correlation between the proportion of Indonesians and percentage of population with at least nursery school education in the United States with a correlation coefficient (R) of -0.166 and weighted average of 96.8%, a difference of 0.62%.
Nursery School Correlation Summary
| Measurement | Immigrants from El Salvador | Indonesian |
| Minimum | 88.3% | 84.3% |
| Maximum | 99.7% | 100.0% |
| Range | 11.4% | 15.7% |
| Mean | 94.8% | 96.2% |
| Median | 94.9% | 96.9% |
| Interquartile 25% (IQ1) | 93.7% | 95.2% |
| Interquartile 75% (IQ3) | 96.0% | 97.7% |
| Interquartile Range (IQR) | 2.3% | 2.4% |
| Standard Deviation (Sample) | 2.0% | 2.7% |
| Standard Deviation (Population) | 2.0% | 2.7% |
Demographics Similar to Immigrants from El Salvador and Indonesians by Nursery School
In terms of nursery school, the demographic groups most similar to Immigrants from El Salvador are Nepalese (96.2%, a difference of 0.010%), Salvadoran (96.4%, a difference of 0.15%), Immigrants from Mexico (96.4%, a difference of 0.18%), Immigrants from Cabo Verde (96.4%, a difference of 0.19%), and Immigrants from Central America (96.4%, a difference of 0.21%). Similarly, the demographic groups most similar to Indonesians are Dominican (96.8%, a difference of 0.0%), Mexican (96.8%, a difference of 0.060%), Immigrants from Latin America (96.7%, a difference of 0.070%), Immigrants from Vietnam (96.7%, a difference of 0.12%), and Japanese (96.7%, a difference of 0.13%).
| Demographics | Rating | Rank | Nursery School |
| Dominicans | 0.0 /100 | #325 | Tragic 96.8% |
| Indonesians | 0.0 /100 | #326 | Tragic 96.8% |
| Mexicans | 0.0 /100 | #327 | Tragic 96.8% |
| Immigrants | Latin America | 0.0 /100 | #328 | Tragic 96.7% |
| Immigrants | Vietnam | 0.0 /100 | #329 | Tragic 96.7% |
| Japanese | 0.0 /100 | #330 | Tragic 96.7% |
| Immigrants | Armenia | 0.0 /100 | #331 | Tragic 96.7% |
| Yakama | 0.0 /100 | #332 | Tragic 96.6% |
| Central Americans | 0.0 /100 | #333 | Tragic 96.6% |
| Immigrants | Dominican Republic | 0.0 /100 | #334 | Tragic 96.6% |
| Bangladeshis | 0.0 /100 | #335 | Tragic 96.6% |
| Guatemalans | 0.0 /100 | #336 | Tragic 96.6% |
| Immigrants | Cambodia | 0.0 /100 | #337 | Tragic 96.5% |
| Immigrants | Fiji | 0.0 /100 | #338 | Tragic 96.5% |
| Immigrants | Guatemala | 0.0 /100 | #339 | Tragic 96.4% |
| Immigrants | Central America | 0.0 /100 | #340 | Tragic 96.4% |
| Immigrants | Cabo Verde | 0.0 /100 | #341 | Tragic 96.4% |
| Immigrants | Mexico | 0.0 /100 | #342 | Tragic 96.4% |
| Salvadorans | 0.0 /100 | #343 | Tragic 96.4% |
| Immigrants | El Salvador | 0.0 /100 | #344 | Tragic 96.2% |
| Nepalese | 0.0 /100 | #345 | Tragic 96.2% |