Immigrants from Guyana vs Indonesian No Schooling Completed
COMPARE
Immigrants from Guyana
Indonesian
No Schooling Completed
No Schooling Completed Comparison
Immigrants from Guyana
Indonesians
3.1%
NO SCHOOLING COMPLETED
0.0/ 100
METRIC RATING
318th/ 347
METRIC RANK
3.2%
NO SCHOOLING COMPLETED
0.0/ 100
METRIC RATING
326th/ 347
METRIC RANK
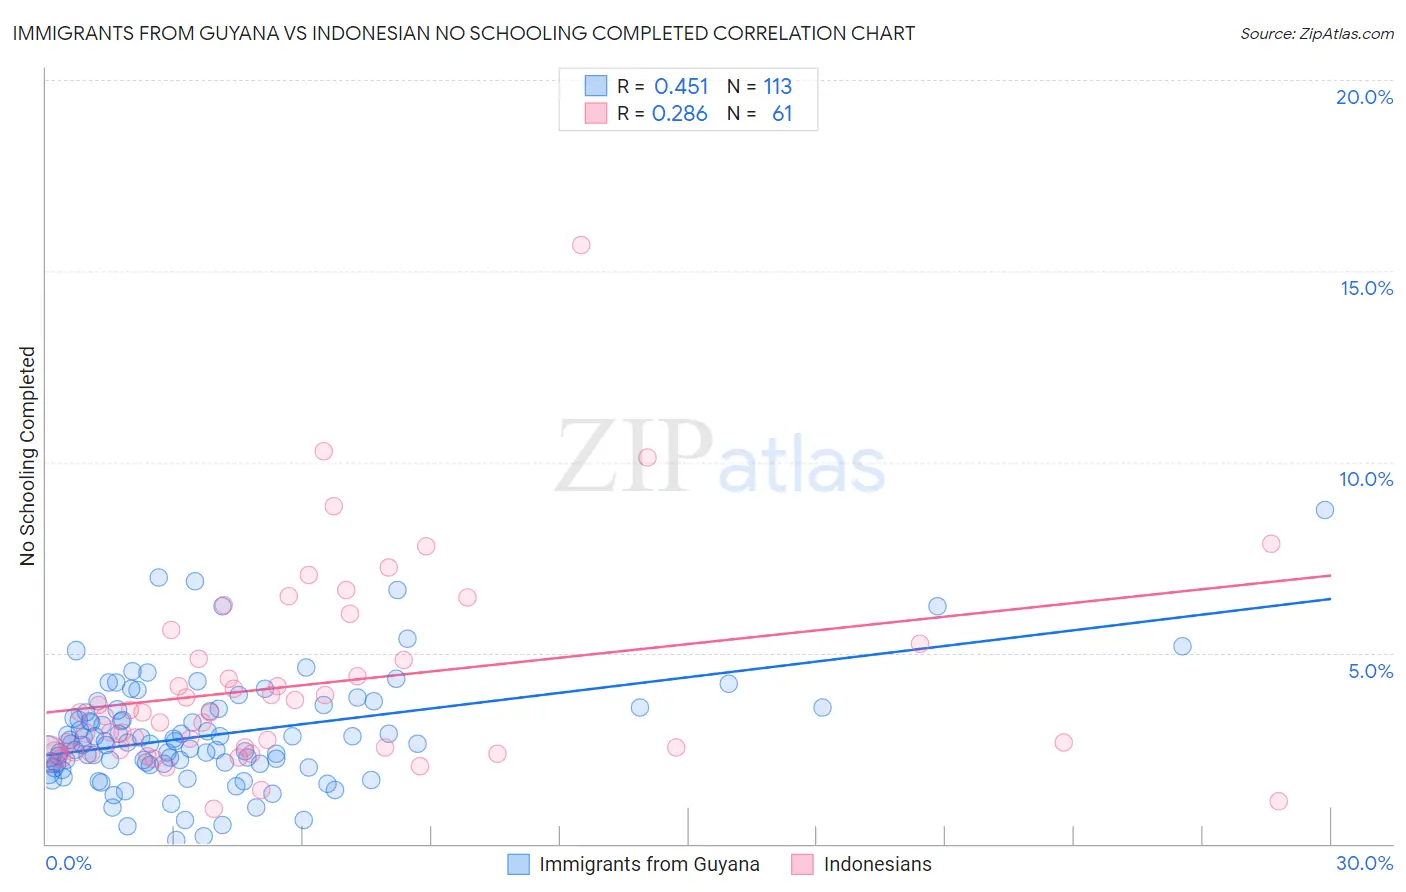
Immigrants from Guyana vs Indonesian No Schooling Completed Correlation Chart
The statistical analysis conducted on geographies consisting of 183,181,054 people shows a moderate positive correlation between the proportion of Immigrants from Guyana and percentage of population with no schooling in the United States with a correlation coefficient (R) of 0.451 and weighted average of 3.1%. Similarly, the statistical analysis conducted on geographies consisting of 162,153,140 people shows a weak positive correlation between the proportion of Indonesians and percentage of population with no schooling in the United States with a correlation coefficient (R) of 0.286 and weighted average of 3.2%, a difference of 2.8%.
No Schooling Completed Correlation Summary
| Measurement | Immigrants from Guyana | Indonesian |
| Minimum | 0.10% | 0.92% |
| Maximum | 8.7% | 15.7% |
| Range | 8.6% | 14.8% |
| Mean | 2.9% | 4.2% |
| Median | 2.6% | 3.4% |
| Interquartile 25% (IQ1) | 2.1% | 2.4% |
| Interquartile 75% (IQ3) | 3.5% | 5.0% |
| Interquartile Range (IQR) | 1.4% | 2.6% |
| Standard Deviation (Sample) | 1.4% | 2.6% |
| Standard Deviation (Population) | 1.4% | 2.6% |
Demographics Similar to Immigrants from Guyana and Indonesians by No Schooling Completed
In terms of no schooling completed, the demographic groups most similar to Immigrants from Guyana are Cape Verdean (3.1%, a difference of 0.68%), Immigrants from Burma/Myanmar (3.1%, a difference of 0.74%), Immigrants from Bangladesh (3.1%, a difference of 0.78%), Immigrants from Laos (3.1%, a difference of 0.89%), and Immigrants from Ecuador (3.1%, a difference of 1.2%). Similarly, the demographic groups most similar to Indonesians are Dominican (3.2%, a difference of 0.030%), Mexican American Indian (3.2%, a difference of 0.70%), Vietnamese (3.2%, a difference of 1.1%), Immigrants from Honduras (3.2%, a difference of 1.2%), and Immigrants from Laos (3.1%, a difference of 1.9%).
| Demographics | Rating | Rank | No Schooling Completed |
| Sri Lankans | 0.0 /100 | #312 | Tragic 3.0% |
| Hondurans | 0.0 /100 | #313 | Tragic 3.1% |
| Immigrants | Belize | 0.0 /100 | #314 | Tragic 3.1% |
| Immigrants | Nicaragua | 0.0 /100 | #315 | Tragic 3.1% |
| Immigrants | Ecuador | 0.0 /100 | #316 | Tragic 3.1% |
| Cape Verdeans | 0.0 /100 | #317 | Tragic 3.1% |
| Immigrants | Guyana | 0.0 /100 | #318 | Tragic 3.1% |
| Immigrants | Burma/Myanmar | 0.0 /100 | #319 | Tragic 3.1% |
| Immigrants | Bangladesh | 0.0 /100 | #320 | Tragic 3.1% |
| Immigrants | Laos | 0.0 /100 | #321 | Tragic 3.1% |
| Immigrants | Honduras | 0.0 /100 | #322 | Tragic 3.2% |
| Vietnamese | 0.0 /100 | #323 | Tragic 3.2% |
| Mexican American Indians | 0.0 /100 | #324 | Tragic 3.2% |
| Dominicans | 0.0 /100 | #325 | Tragic 3.2% |
| Indonesians | 0.0 /100 | #326 | Tragic 3.2% |
| Immigrants | Latin America | 0.0 /100 | #327 | Tragic 3.3% |
| Mexicans | 0.0 /100 | #328 | Tragic 3.3% |
| Immigrants | Vietnam | 0.0 /100 | #329 | Tragic 3.3% |
| Immigrants | Armenia | 0.0 /100 | #330 | Tragic 3.3% |
| Japanese | 0.0 /100 | #331 | Tragic 3.3% |
| Central Americans | 0.0 /100 | #332 | Tragic 3.4% |