Tsimshian vs Cuban 11th Grade
COMPARE
Tsimshian
Cuban
11th Grade
11th Grade Comparison
Tsimshian
Cubans
94.4%
11TH GRADE
100.0/ 100
METRIC RATING
22nd/ 347
METRIC RANK
90.2%
11TH GRADE
0.0/ 100
METRIC RATING
292nd/ 347
METRIC RANK
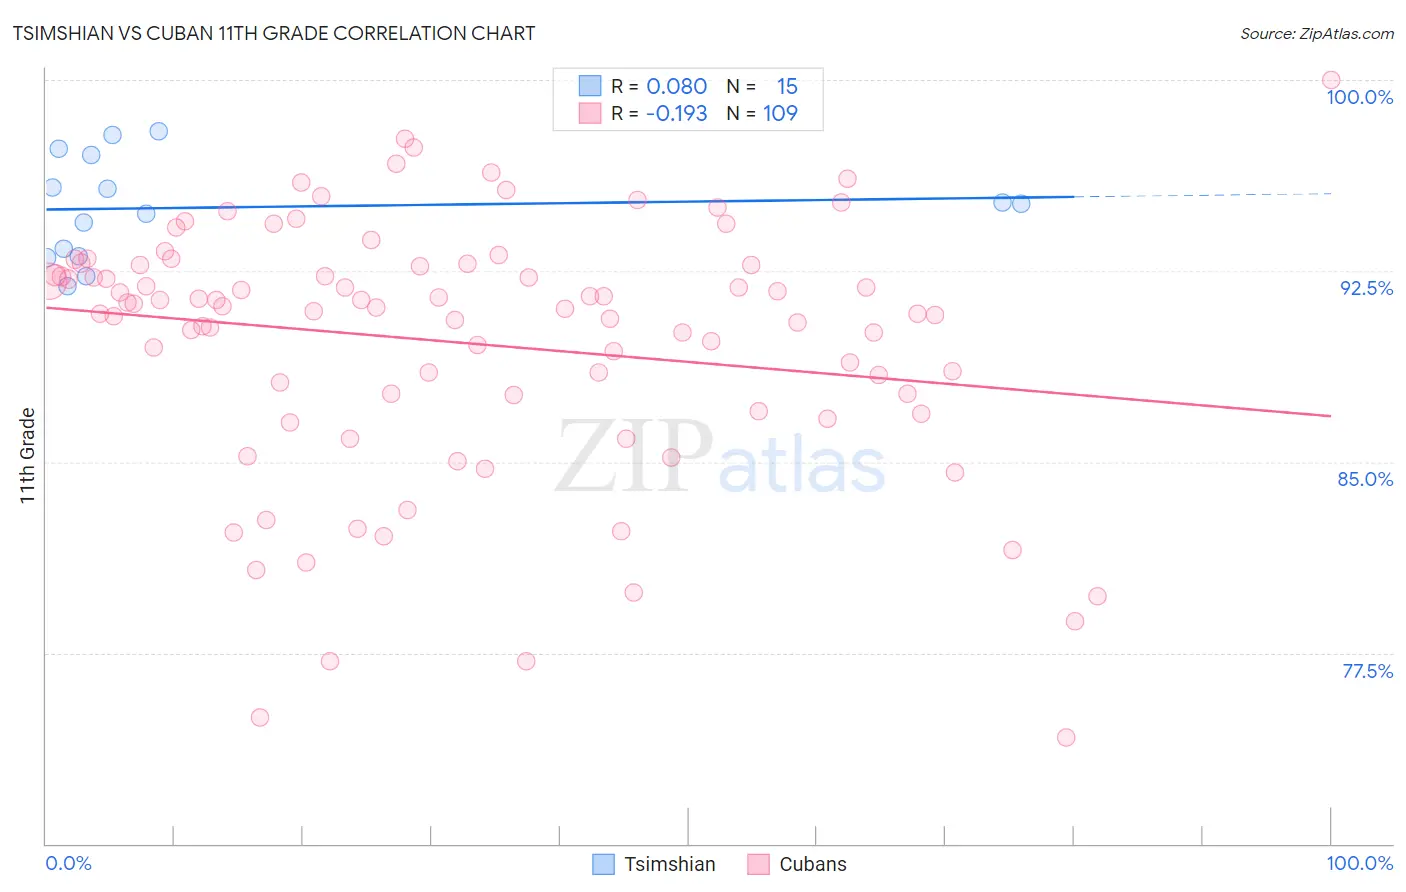
Tsimshian vs Cuban 11th Grade Correlation Chart
The statistical analysis conducted on geographies consisting of 15,626,544 people shows a slight positive correlation between the proportion of Tsimshian and percentage of population with at least 11th grade education in the United States with a correlation coefficient (R) of 0.080 and weighted average of 94.4%. Similarly, the statistical analysis conducted on geographies consisting of 449,369,652 people shows a poor negative correlation between the proportion of Cubans and percentage of population with at least 11th grade education in the United States with a correlation coefficient (R) of -0.193 and weighted average of 90.2%, a difference of 4.6%.
11th Grade Correlation Summary
| Measurement | Tsimshian | Cuban |
| Minimum | 91.9% | 74.2% |
| Maximum | 98.0% | 100.0% |
| Range | 6.1% | 25.8% |
| Mean | 95.0% | 89.7% |
| Median | 95.1% | 91.1% |
| Interquartile 25% (IQ1) | 93.1% | 87.3% |
| Interquartile 75% (IQ3) | 97.0% | 92.7% |
| Interquartile Range (IQR) | 4.0% | 5.4% |
| Standard Deviation (Sample) | 2.0% | 5.1% |
| Standard Deviation (Population) | 1.9% | 5.0% |
Similar Demographics by 11th Grade
Demographics Similar to Tsimshian by 11th Grade
In terms of 11th grade, the demographic groups most similar to Tsimshian are Czech (94.4%, a difference of 0.0%), Tlingit-Haida (94.4%, a difference of 0.010%), Italian (94.5%, a difference of 0.020%), English (94.4%, a difference of 0.030%), and Irish (94.4%, a difference of 0.050%).
| Demographics | Rating | Rank | 11th Grade |
| Bulgarians | 100.0 /100 | #15 | Exceptional 94.5% |
| Immigrants | India | 100.0 /100 | #16 | Exceptional 94.5% |
| Luxembourgers | 100.0 /100 | #17 | Exceptional 94.5% |
| Maltese | 100.0 /100 | #18 | Exceptional 94.5% |
| Scandinavians | 100.0 /100 | #19 | Exceptional 94.5% |
| Italians | 100.0 /100 | #20 | Exceptional 94.5% |
| Tlingit-Haida | 100.0 /100 | #21 | Exceptional 94.4% |
| Tsimshian | 100.0 /100 | #22 | Exceptional 94.4% |
| Czechs | 100.0 /100 | #23 | Exceptional 94.4% |
| English | 100.0 /100 | #24 | Exceptional 94.4% |
| Irish | 100.0 /100 | #25 | Exceptional 94.4% |
| Scottish | 100.0 /100 | #26 | Exceptional 94.4% |
| Europeans | 100.0 /100 | #27 | Exceptional 94.4% |
| Estonians | 100.0 /100 | #28 | Exceptional 94.4% |
| Dutch | 100.0 /100 | #29 | Exceptional 94.3% |
Demographics Similar to Cubans by 11th Grade
In terms of 11th grade, the demographic groups most similar to Cubans are Haitian (90.3%, a difference of 0.030%), Indonesian (90.3%, a difference of 0.070%), Native/Alaskan (90.2%, a difference of 0.070%), British West Indian (90.3%, a difference of 0.090%), and Pennsylvania German (90.3%, a difference of 0.11%).
| Demographics | Rating | Rank | 11th Grade |
| Immigrants | Burma/Myanmar | 0.0 /100 | #285 | Tragic 90.4% |
| Immigrants | West Indies | 0.0 /100 | #286 | Tragic 90.4% |
| Apache | 0.0 /100 | #287 | Tragic 90.4% |
| Pennsylvania Germans | 0.0 /100 | #288 | Tragic 90.3% |
| British West Indians | 0.0 /100 | #289 | Tragic 90.3% |
| Indonesians | 0.0 /100 | #290 | Tragic 90.3% |
| Haitians | 0.0 /100 | #291 | Tragic 90.3% |
| Cubans | 0.0 /100 | #292 | Tragic 90.2% |
| Natives/Alaskans | 0.0 /100 | #293 | Tragic 90.2% |
| Immigrants | Grenada | 0.0 /100 | #294 | Tragic 90.1% |
| Immigrants | Vietnam | 0.0 /100 | #295 | Tragic 90.0% |
| Fijians | 0.0 /100 | #296 | Tragic 90.0% |
| Navajo | 0.0 /100 | #297 | Tragic 90.0% |
| Immigrants | Fiji | 0.0 /100 | #298 | Tragic 89.9% |
| Japanese | 0.0 /100 | #299 | Tragic 89.9% |