Okinawan vs Cuban 11th Grade
COMPARE
Okinawan
Cuban
11th Grade
11th Grade Comparison
Okinawans
Cubans
94.0%
11TH GRADE
99.8/ 100
METRIC RATING
60th/ 347
METRIC RANK
90.2%
11TH GRADE
0.0/ 100
METRIC RATING
292nd/ 347
METRIC RANK
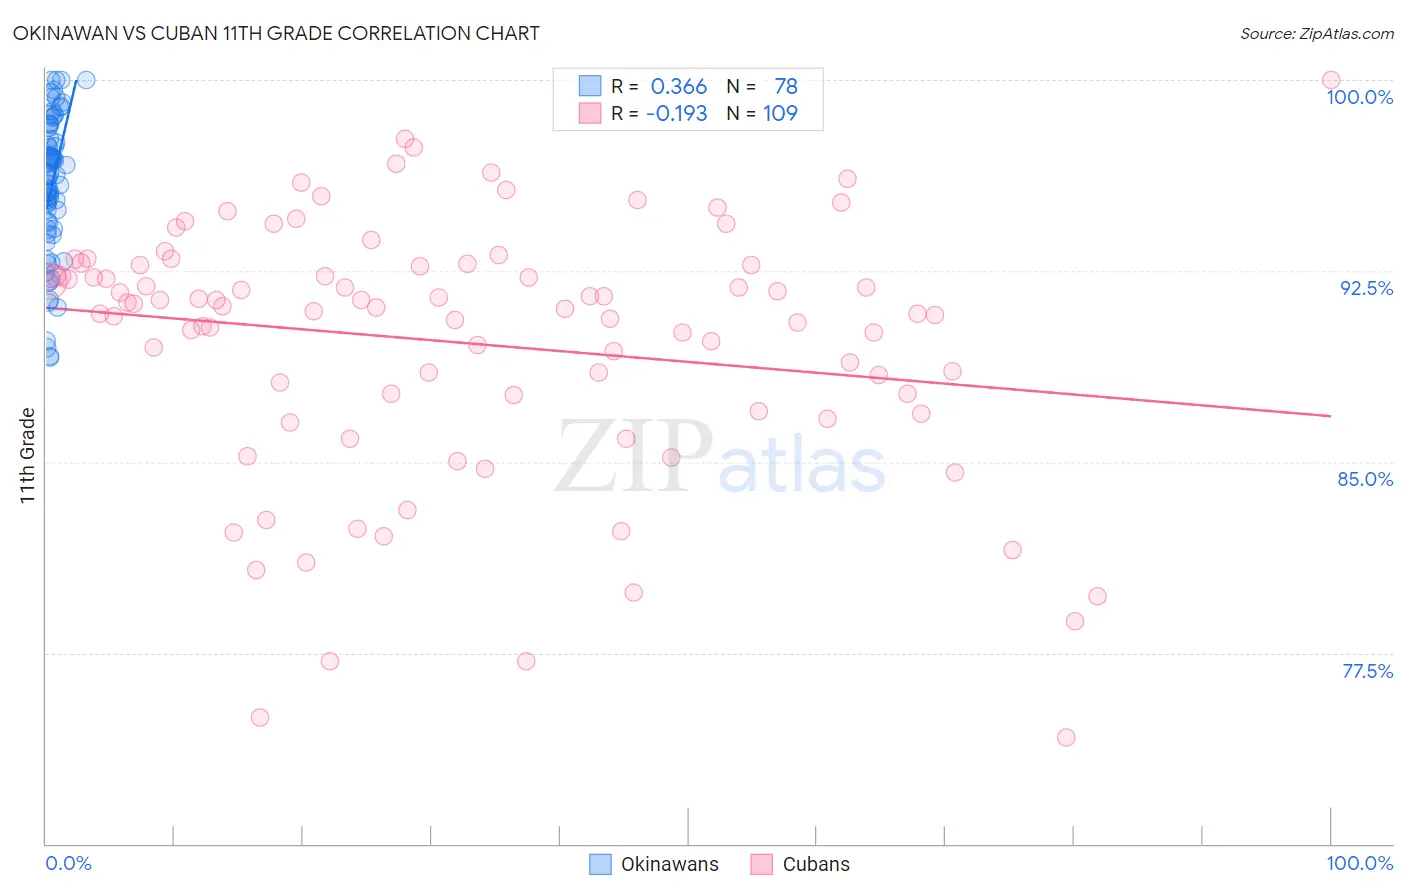
Okinawan vs Cuban 11th Grade Correlation Chart
The statistical analysis conducted on geographies consisting of 73,775,797 people shows a mild positive correlation between the proportion of Okinawans and percentage of population with at least 11th grade education in the United States with a correlation coefficient (R) of 0.366 and weighted average of 94.0%. Similarly, the statistical analysis conducted on geographies consisting of 449,369,652 people shows a poor negative correlation between the proportion of Cubans and percentage of population with at least 11th grade education in the United States with a correlation coefficient (R) of -0.193 and weighted average of 90.2%, a difference of 4.2%.
11th Grade Correlation Summary
| Measurement | Okinawan | Cuban |
| Minimum | 89.1% | 74.2% |
| Maximum | 100.0% | 100.0% |
| Range | 10.9% | 25.8% |
| Mean | 95.9% | 89.7% |
| Median | 96.2% | 91.1% |
| Interquartile 25% (IQ1) | 94.1% | 87.3% |
| Interquartile 75% (IQ3) | 98.1% | 92.7% |
| Interquartile Range (IQR) | 4.0% | 5.4% |
| Standard Deviation (Sample) | 2.8% | 5.1% |
| Standard Deviation (Population) | 2.7% | 5.0% |
Similar Demographics by 11th Grade
Demographics Similar to Okinawans by 11th Grade
In terms of 11th grade, the demographic groups most similar to Okinawans are French Canadian (94.0%, a difference of 0.0%), New Zealander (94.0%, a difference of 0.0%), Iranian (94.0%, a difference of 0.0%), Bhutanese (94.0%, a difference of 0.0%), and Immigrants from North America (94.0%, a difference of 0.010%).
| Demographics | Rating | Rank | 11th Grade |
| Immigrants | Australia | 99.9 /100 | #53 | Exceptional 94.0% |
| Immigrants | North America | 99.9 /100 | #54 | Exceptional 94.0% |
| Czechoslovakians | 99.9 /100 | #55 | Exceptional 94.0% |
| French Canadians | 99.9 /100 | #56 | Exceptional 94.0% |
| New Zealanders | 99.9 /100 | #57 | Exceptional 94.0% |
| Iranians | 99.9 /100 | #58 | Exceptional 94.0% |
| Bhutanese | 99.8 /100 | #59 | Exceptional 94.0% |
| Okinawans | 99.8 /100 | #60 | Exceptional 94.0% |
| Immigrants | Belgium | 99.8 /100 | #61 | Exceptional 94.0% |
| Austrians | 99.8 /100 | #62 | Exceptional 94.0% |
| Ukrainians | 99.8 /100 | #63 | Exceptional 94.0% |
| Immigrants | Sweden | 99.8 /100 | #64 | Exceptional 93.9% |
| Native Hawaiians | 99.8 /100 | #65 | Exceptional 93.9% |
| Alaskan Athabascans | 99.8 /100 | #66 | Exceptional 93.9% |
| Immigrants | Netherlands | 99.8 /100 | #67 | Exceptional 93.9% |
Demographics Similar to Cubans by 11th Grade
In terms of 11th grade, the demographic groups most similar to Cubans are Haitian (90.3%, a difference of 0.030%), Indonesian (90.3%, a difference of 0.070%), Native/Alaskan (90.2%, a difference of 0.070%), British West Indian (90.3%, a difference of 0.090%), and Pennsylvania German (90.3%, a difference of 0.11%).
| Demographics | Rating | Rank | 11th Grade |
| Immigrants | Burma/Myanmar | 0.0 /100 | #285 | Tragic 90.4% |
| Immigrants | West Indies | 0.0 /100 | #286 | Tragic 90.4% |
| Apache | 0.0 /100 | #287 | Tragic 90.4% |
| Pennsylvania Germans | 0.0 /100 | #288 | Tragic 90.3% |
| British West Indians | 0.0 /100 | #289 | Tragic 90.3% |
| Indonesians | 0.0 /100 | #290 | Tragic 90.3% |
| Haitians | 0.0 /100 | #291 | Tragic 90.3% |
| Cubans | 0.0 /100 | #292 | Tragic 90.2% |
| Natives/Alaskans | 0.0 /100 | #293 | Tragic 90.2% |
| Immigrants | Grenada | 0.0 /100 | #294 | Tragic 90.1% |
| Immigrants | Vietnam | 0.0 /100 | #295 | Tragic 90.0% |
| Fijians | 0.0 /100 | #296 | Tragic 90.0% |
| Navajo | 0.0 /100 | #297 | Tragic 90.0% |
| Immigrants | Fiji | 0.0 /100 | #298 | Tragic 89.9% |
| Japanese | 0.0 /100 | #299 | Tragic 89.9% |