West Indian vs Cuban 11th Grade
COMPARE
West Indian
Cuban
11th Grade
11th Grade Comparison
West Indians
Cubans
91.0%
11TH GRADE
0.1/ 100
METRIC RATING
272nd/ 347
METRIC RANK
90.2%
11TH GRADE
0.0/ 100
METRIC RATING
292nd/ 347
METRIC RANK
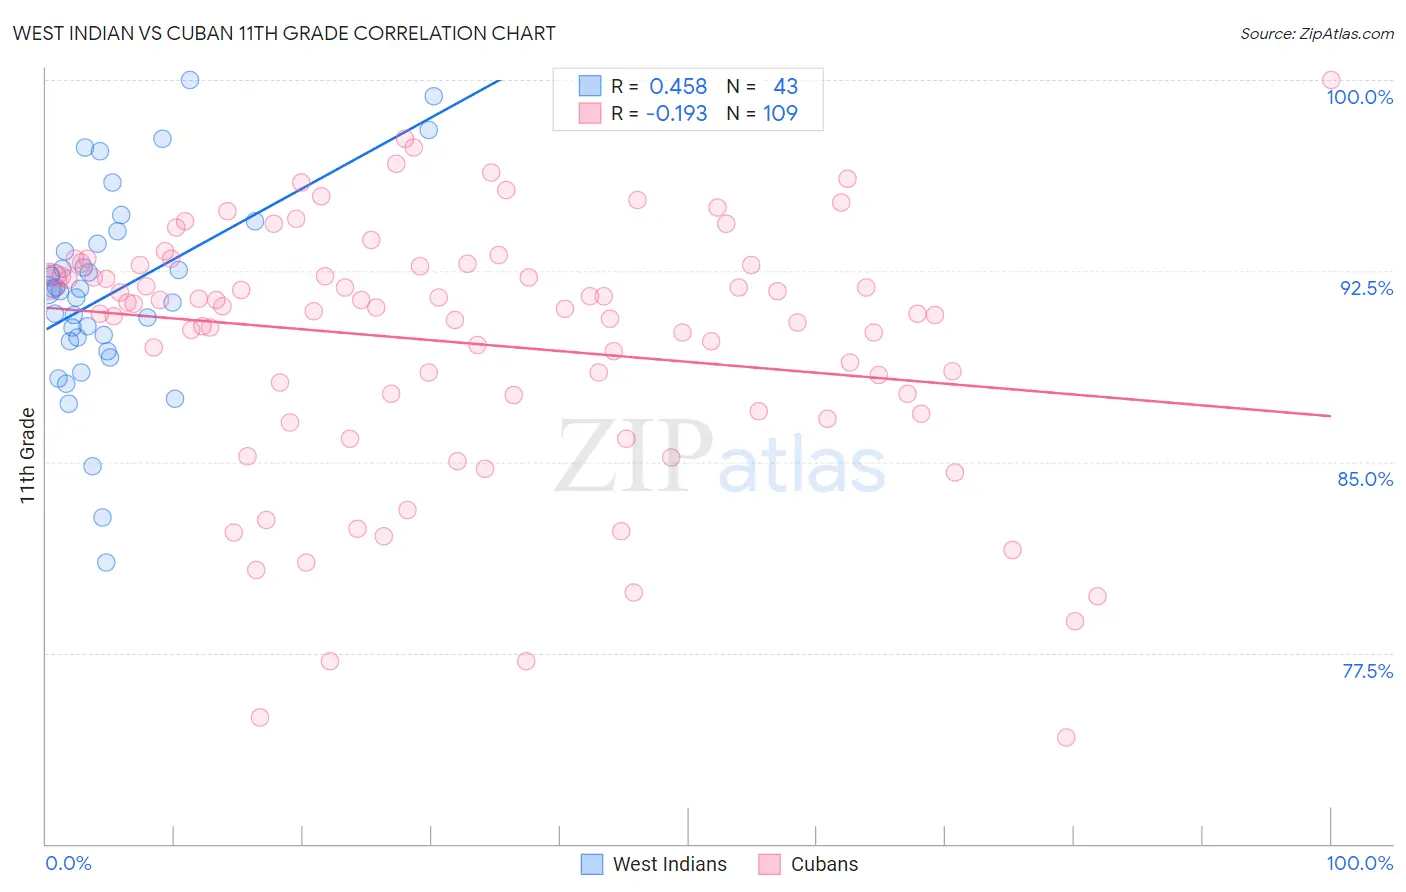
West Indian vs Cuban 11th Grade Correlation Chart
The statistical analysis conducted on geographies consisting of 254,059,006 people shows a moderate positive correlation between the proportion of West Indians and percentage of population with at least 11th grade education in the United States with a correlation coefficient (R) of 0.458 and weighted average of 91.0%. Similarly, the statistical analysis conducted on geographies consisting of 449,369,652 people shows a poor negative correlation between the proportion of Cubans and percentage of population with at least 11th grade education in the United States with a correlation coefficient (R) of -0.193 and weighted average of 90.2%, a difference of 0.86%.
11th Grade Correlation Summary
| Measurement | West Indian | Cuban |
| Minimum | 81.1% | 74.2% |
| Maximum | 100.0% | 100.0% |
| Range | 18.9% | 25.8% |
| Mean | 91.7% | 89.7% |
| Median | 91.7% | 91.1% |
| Interquartile 25% (IQ1) | 89.7% | 87.3% |
| Interquartile 75% (IQ3) | 93.6% | 92.7% |
| Interquartile Range (IQR) | 3.8% | 5.4% |
| Standard Deviation (Sample) | 4.0% | 5.1% |
| Standard Deviation (Population) | 3.9% | 5.0% |
Demographics Similar to West Indians and Cubans by 11th Grade
In terms of 11th grade, the demographic groups most similar to West Indians are Paiute (91.0%, a difference of 0.050%), Immigrants from Trinidad and Tobago (90.9%, a difference of 0.090%), Immigrants from South Eastern Asia (90.9%, a difference of 0.10%), Bangladeshi (90.9%, a difference of 0.17%), and Immigrants from Congo (90.9%, a difference of 0.19%). Similarly, the demographic groups most similar to Cubans are Haitian (90.3%, a difference of 0.030%), Indonesian (90.3%, a difference of 0.070%), British West Indian (90.3%, a difference of 0.090%), Pennsylvania German (90.3%, a difference of 0.11%), and Immigrants from West Indies (90.4%, a difference of 0.14%).
| Demographics | Rating | Rank | 11th Grade |
| West Indians | 0.1 /100 | #272 | Tragic 91.0% |
| Paiute | 0.1 /100 | #273 | Tragic 91.0% |
| Immigrants | Trinidad and Tobago | 0.1 /100 | #274 | Tragic 90.9% |
| Immigrants | South Eastern Asia | 0.1 /100 | #275 | Tragic 90.9% |
| Bangladeshis | 0.1 /100 | #276 | Tragic 90.9% |
| Immigrants | Congo | 0.1 /100 | #277 | Tragic 90.9% |
| Malaysians | 0.1 /100 | #278 | Tragic 90.8% |
| Barbadians | 0.0 /100 | #279 | Tragic 90.8% |
| Sri Lankans | 0.0 /100 | #280 | Tragic 90.7% |
| Dutch West Indians | 0.0 /100 | #281 | Tragic 90.7% |
| Immigrants | St. Vincent and the Grenadines | 0.0 /100 | #282 | Tragic 90.7% |
| Immigrants | Barbados | 0.0 /100 | #283 | Tragic 90.7% |
| Immigrants | Laos | 0.0 /100 | #284 | Tragic 90.5% |
| Immigrants | Burma/Myanmar | 0.0 /100 | #285 | Tragic 90.4% |
| Immigrants | West Indies | 0.0 /100 | #286 | Tragic 90.4% |
| Apache | 0.0 /100 | #287 | Tragic 90.4% |
| Pennsylvania Germans | 0.0 /100 | #288 | Tragic 90.3% |
| British West Indians | 0.0 /100 | #289 | Tragic 90.3% |
| Indonesians | 0.0 /100 | #290 | Tragic 90.3% |
| Haitians | 0.0 /100 | #291 | Tragic 90.3% |
| Cubans | 0.0 /100 | #292 | Tragic 90.2% |