Immigrants from Guyana vs Immigrants from Ecuador 11th Grade
COMPARE
Immigrants from Guyana
Immigrants from Ecuador
11th Grade
11th Grade Comparison
Immigrants from Guyana
Immigrants from Ecuador
89.7%
11TH GRADE
0.0/ 100
METRIC RATING
302nd/ 347
METRIC RANK
89.1%
11TH GRADE
0.0/ 100
METRIC RATING
315th/ 347
METRIC RANK
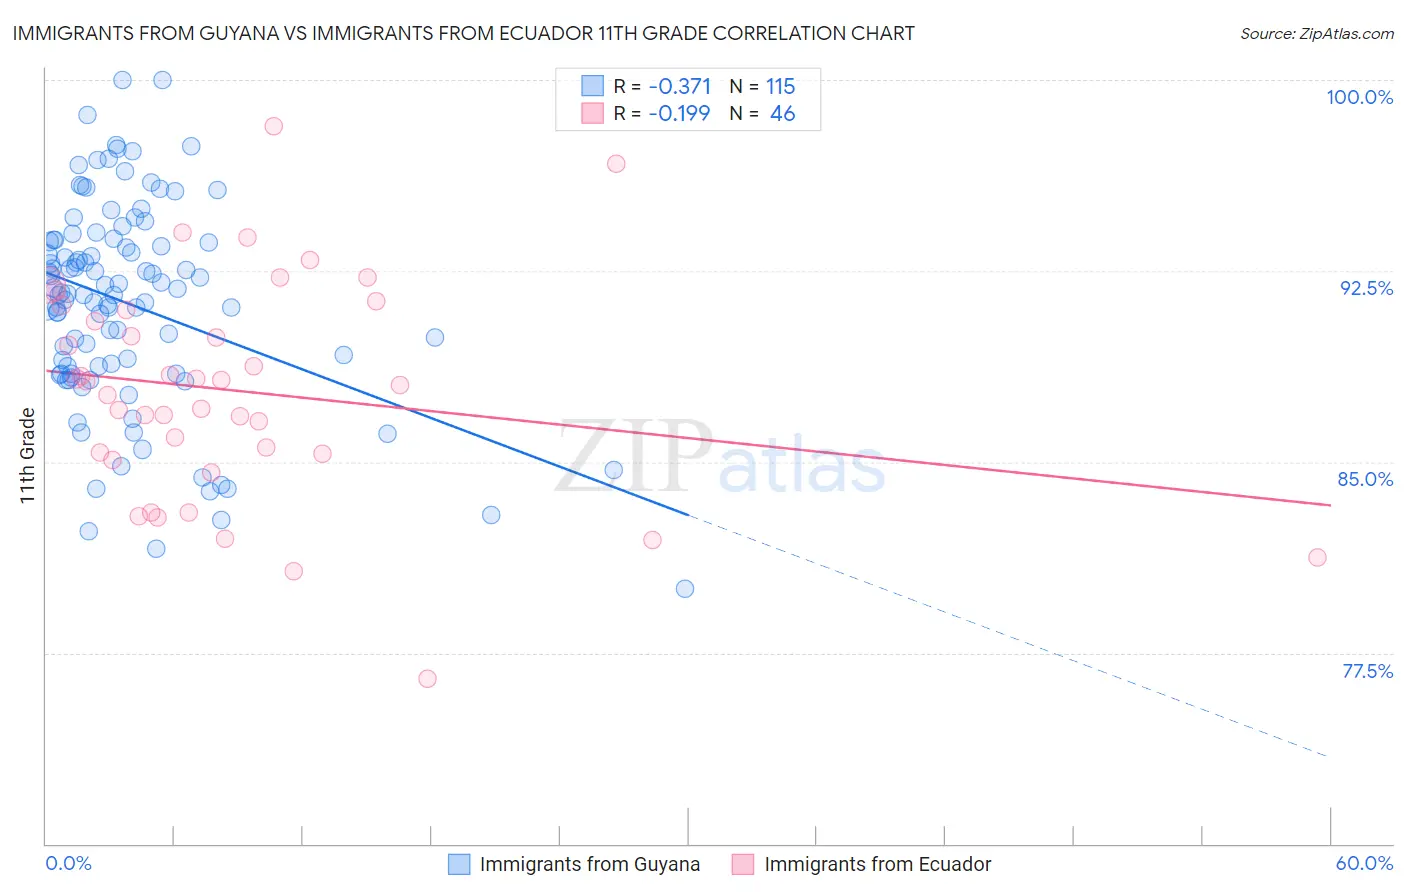
Immigrants from Guyana vs Immigrants from Ecuador 11th Grade Correlation Chart
The statistical analysis conducted on geographies consisting of 183,673,461 people shows a mild negative correlation between the proportion of Immigrants from Guyana and percentage of population with at least 11th grade education in the United States with a correlation coefficient (R) of -0.371 and weighted average of 89.7%. Similarly, the statistical analysis conducted on geographies consisting of 270,907,929 people shows a poor negative correlation between the proportion of Immigrants from Ecuador and percentage of population with at least 11th grade education in the United States with a correlation coefficient (R) of -0.199 and weighted average of 89.1%, a difference of 0.72%.
11th Grade Correlation Summary
| Measurement | Immigrants from Guyana | Immigrants from Ecuador |
| Minimum | 80.0% | 76.5% |
| Maximum | 100.0% | 98.2% |
| Range | 20.0% | 21.7% |
| Mean | 91.2% | 87.8% |
| Median | 91.6% | 88.1% |
| Interquartile 25% (IQ1) | 88.5% | 85.3% |
| Interquartile 75% (IQ3) | 93.7% | 91.0% |
| Interquartile Range (IQR) | 5.2% | 5.7% |
| Standard Deviation (Sample) | 4.1% | 4.3% |
| Standard Deviation (Population) | 4.0% | 4.3% |
Demographics Similar to Immigrants from Guyana and Immigrants from Ecuador by 11th Grade
In terms of 11th grade, the demographic groups most similar to Immigrants from Guyana are Immigrants (89.7%, a difference of 0.010%), Yuman (89.7%, a difference of 0.010%), Immigrants from Cambodia (89.6%, a difference of 0.090%), Ecuadorian (89.6%, a difference of 0.14%), and Guyanese (89.9%, a difference of 0.19%). Similarly, the demographic groups most similar to Immigrants from Ecuador are Cape Verdean (89.1%, a difference of 0.010%), Immigrants from Caribbean (89.1%, a difference of 0.030%), Immigrants from Cuba (88.9%, a difference of 0.15%), Lumbee (88.9%, a difference of 0.16%), and Nicaraguan (88.9%, a difference of 0.22%).
| Demographics | Rating | Rank | 11th Grade |
| Immigrants | Fiji | 0.0 /100 | #298 | Tragic 89.9% |
| Japanese | 0.0 /100 | #299 | Tragic 89.9% |
| Immigrants | Haiti | 0.0 /100 | #300 | Tragic 89.9% |
| Guyanese | 0.0 /100 | #301 | Tragic 89.9% |
| Immigrants | Guyana | 0.0 /100 | #302 | Tragic 89.7% |
| Immigrants | Immigrants | 0.0 /100 | #303 | Tragic 89.7% |
| Yuman | 0.0 /100 | #304 | Tragic 89.7% |
| Immigrants | Cambodia | 0.0 /100 | #305 | Tragic 89.6% |
| Ecuadorians | 0.0 /100 | #306 | Tragic 89.6% |
| Immigrants | Dominica | 0.0 /100 | #307 | Tragic 89.5% |
| Nepalese | 0.0 /100 | #308 | Tragic 89.5% |
| Immigrants | Bangladesh | 0.0 /100 | #309 | Tragic 89.5% |
| Yaqui | 0.0 /100 | #310 | Tragic 89.5% |
| Vietnamese | 0.0 /100 | #311 | Tragic 89.4% |
| Immigrants | Portugal | 0.0 /100 | #312 | Tragic 89.3% |
| Immigrants | Caribbean | 0.0 /100 | #313 | Tragic 89.1% |
| Cape Verdeans | 0.0 /100 | #314 | Tragic 89.1% |
| Immigrants | Ecuador | 0.0 /100 | #315 | Tragic 89.1% |
| Immigrants | Cuba | 0.0 /100 | #316 | Tragic 88.9% |
| Lumbee | 0.0 /100 | #317 | Tragic 88.9% |
| Nicaraguans | 0.0 /100 | #318 | Tragic 88.9% |