Shoshone vs Cuban 11th Grade
COMPARE
Shoshone
Cuban
11th Grade
11th Grade Comparison
Shoshone
Cubans
92.5%
11TH GRADE
48.9/ 100
METRIC RATING
175th/ 347
METRIC RANK
90.2%
11TH GRADE
0.0/ 100
METRIC RATING
292nd/ 347
METRIC RANK
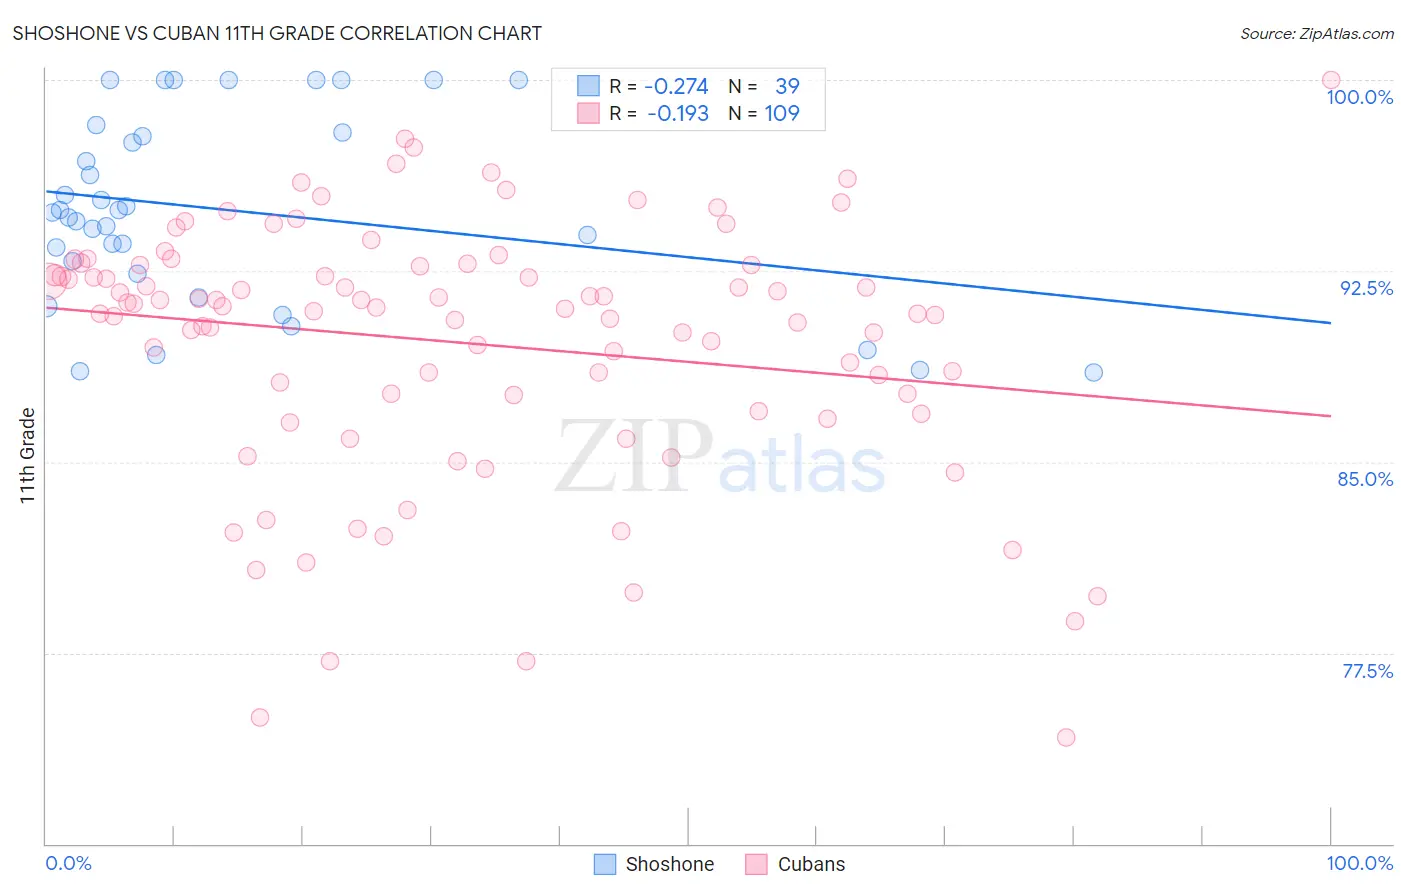
Shoshone vs Cuban 11th Grade Correlation Chart
The statistical analysis conducted on geographies consisting of 66,625,086 people shows a weak negative correlation between the proportion of Shoshone and percentage of population with at least 11th grade education in the United States with a correlation coefficient (R) of -0.274 and weighted average of 92.5%. Similarly, the statistical analysis conducted on geographies consisting of 449,369,652 people shows a poor negative correlation between the proportion of Cubans and percentage of population with at least 11th grade education in the United States with a correlation coefficient (R) of -0.193 and weighted average of 90.2%, a difference of 2.5%.
11th Grade Correlation Summary
| Measurement | Shoshone | Cuban |
| Minimum | 88.5% | 74.2% |
| Maximum | 100.0% | 100.0% |
| Range | 11.5% | 25.8% |
| Mean | 94.9% | 89.7% |
| Median | 94.8% | 91.1% |
| Interquartile 25% (IQ1) | 92.4% | 87.3% |
| Interquartile 75% (IQ3) | 97.9% | 92.7% |
| Interquartile Range (IQR) | 5.5% | 5.4% |
| Standard Deviation (Sample) | 3.7% | 5.1% |
| Standard Deviation (Population) | 3.6% | 5.0% |
Similar Demographics by 11th Grade
Demographics Similar to Shoshone by 11th Grade
In terms of 11th grade, the demographic groups most similar to Shoshone are Asian (92.5%, a difference of 0.010%), Spaniard (92.5%, a difference of 0.020%), Immigrants from Pakistan (92.5%, a difference of 0.030%), Indian (Asian) (92.5%, a difference of 0.030%), and Guamanian/Chamorro (92.5%, a difference of 0.040%).
| Demographics | Rating | Rank | 11th Grade |
| Sierra Leoneans | 58.7 /100 | #168 | Average 92.6% |
| Immigrants | Albania | 57.8 /100 | #169 | Average 92.6% |
| Immigrants | Northern Africa | 57.3 /100 | #170 | Average 92.6% |
| Laotians | 54.4 /100 | #171 | Average 92.6% |
| Immigrants | Pakistan | 52.3 /100 | #172 | Average 92.5% |
| Indians (Asian) | 51.5 /100 | #173 | Average 92.5% |
| Asians | 50.0 /100 | #174 | Average 92.5% |
| Shoshone | 48.9 /100 | #175 | Average 92.5% |
| Spaniards | 46.9 /100 | #176 | Average 92.5% |
| Guamanians/Chamorros | 45.0 /100 | #177 | Average 92.5% |
| Sudanese | 43.4 /100 | #178 | Average 92.5% |
| Creek | 40.9 /100 | #179 | Average 92.4% |
| Inupiat | 40.7 /100 | #180 | Average 92.4% |
| Cherokee | 40.7 /100 | #181 | Average 92.4% |
| Immigrants | Morocco | 38.6 /100 | #182 | Fair 92.4% |
Demographics Similar to Cubans by 11th Grade
In terms of 11th grade, the demographic groups most similar to Cubans are Haitian (90.3%, a difference of 0.030%), Indonesian (90.3%, a difference of 0.070%), Native/Alaskan (90.2%, a difference of 0.070%), British West Indian (90.3%, a difference of 0.090%), and Pennsylvania German (90.3%, a difference of 0.11%).
| Demographics | Rating | Rank | 11th Grade |
| Immigrants | Burma/Myanmar | 0.0 /100 | #285 | Tragic 90.4% |
| Immigrants | West Indies | 0.0 /100 | #286 | Tragic 90.4% |
| Apache | 0.0 /100 | #287 | Tragic 90.4% |
| Pennsylvania Germans | 0.0 /100 | #288 | Tragic 90.3% |
| British West Indians | 0.0 /100 | #289 | Tragic 90.3% |
| Indonesians | 0.0 /100 | #290 | Tragic 90.3% |
| Haitians | 0.0 /100 | #291 | Tragic 90.3% |
| Cubans | 0.0 /100 | #292 | Tragic 90.2% |
| Natives/Alaskans | 0.0 /100 | #293 | Tragic 90.2% |
| Immigrants | Grenada | 0.0 /100 | #294 | Tragic 90.1% |
| Immigrants | Vietnam | 0.0 /100 | #295 | Tragic 90.0% |
| Fijians | 0.0 /100 | #296 | Tragic 90.0% |
| Navajo | 0.0 /100 | #297 | Tragic 90.0% |
| Immigrants | Fiji | 0.0 /100 | #298 | Tragic 89.9% |
| Japanese | 0.0 /100 | #299 | Tragic 89.9% |