Immigrants from Guyana vs Chippewa 11th Grade
COMPARE
Immigrants from Guyana
Chippewa
11th Grade
11th Grade Comparison
Immigrants from Guyana
Chippewa
89.7%
11TH GRADE
0.0/ 100
METRIC RATING
302nd/ 347
METRIC RANK
93.5%
11TH GRADE
98.6/ 100
METRIC RATING
102nd/ 347
METRIC RANK
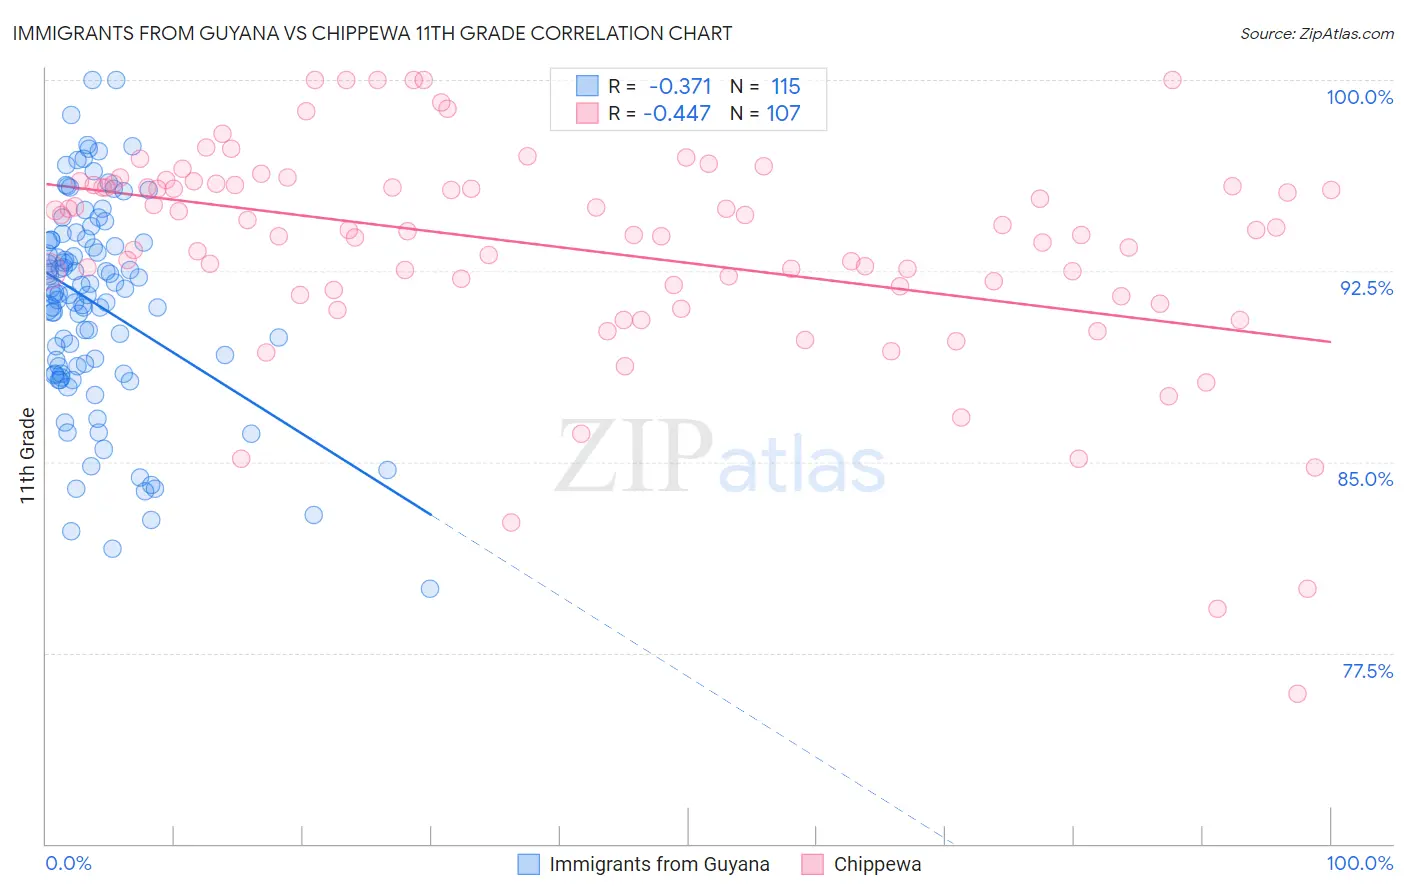
Immigrants from Guyana vs Chippewa 11th Grade Correlation Chart
The statistical analysis conducted on geographies consisting of 183,673,461 people shows a mild negative correlation between the proportion of Immigrants from Guyana and percentage of population with at least 11th grade education in the United States with a correlation coefficient (R) of -0.371 and weighted average of 89.7%. Similarly, the statistical analysis conducted on geographies consisting of 215,068,316 people shows a moderate negative correlation between the proportion of Chippewa and percentage of population with at least 11th grade education in the United States with a correlation coefficient (R) of -0.447 and weighted average of 93.5%, a difference of 4.2%.
11th Grade Correlation Summary
| Measurement | Immigrants from Guyana | Chippewa |
| Minimum | 80.0% | 75.9% |
| Maximum | 100.0% | 100.0% |
| Range | 20.0% | 24.1% |
| Mean | 91.2% | 93.4% |
| Median | 91.6% | 94.1% |
| Interquartile 25% (IQ1) | 88.5% | 91.8% |
| Interquartile 75% (IQ3) | 93.7% | 95.9% |
| Interquartile Range (IQR) | 5.2% | 4.1% |
| Standard Deviation (Sample) | 4.1% | 4.3% |
| Standard Deviation (Population) | 4.0% | 4.3% |
Similar Demographics by 11th Grade
Demographics Similar to Immigrants from Guyana by 11th Grade
In terms of 11th grade, the demographic groups most similar to Immigrants from Guyana are Immigrants (89.7%, a difference of 0.010%), Yuman (89.7%, a difference of 0.010%), Immigrants from Cambodia (89.6%, a difference of 0.090%), Ecuadorian (89.6%, a difference of 0.14%), and Guyanese (89.9%, a difference of 0.19%).
| Demographics | Rating | Rank | 11th Grade |
| Immigrants | Vietnam | 0.0 /100 | #295 | Tragic 90.0% |
| Fijians | 0.0 /100 | #296 | Tragic 90.0% |
| Navajo | 0.0 /100 | #297 | Tragic 90.0% |
| Immigrants | Fiji | 0.0 /100 | #298 | Tragic 89.9% |
| Japanese | 0.0 /100 | #299 | Tragic 89.9% |
| Immigrants | Haiti | 0.0 /100 | #300 | Tragic 89.9% |
| Guyanese | 0.0 /100 | #301 | Tragic 89.9% |
| Immigrants | Guyana | 0.0 /100 | #302 | Tragic 89.7% |
| Immigrants | Immigrants | 0.0 /100 | #303 | Tragic 89.7% |
| Yuman | 0.0 /100 | #304 | Tragic 89.7% |
| Immigrants | Cambodia | 0.0 /100 | #305 | Tragic 89.6% |
| Ecuadorians | 0.0 /100 | #306 | Tragic 89.6% |
| Immigrants | Dominica | 0.0 /100 | #307 | Tragic 89.5% |
| Nepalese | 0.0 /100 | #308 | Tragic 89.5% |
| Immigrants | Bangladesh | 0.0 /100 | #309 | Tragic 89.5% |
Demographics Similar to Chippewa by 11th Grade
In terms of 11th grade, the demographic groups most similar to Chippewa are Lebanese (93.5%, a difference of 0.0%), Immigrants from Europe (93.5%, a difference of 0.0%), Immigrants from Serbia (93.5%, a difference of 0.0%), Immigrants from Romania (93.5%, a difference of 0.010%), and Immigrants from Croatia (93.5%, a difference of 0.010%).
| Demographics | Rating | Rank | 11th Grade |
| Immigrants | France | 99.0 /100 | #95 | Exceptional 93.6% |
| Immigrants | Turkey | 98.9 /100 | #96 | Exceptional 93.5% |
| Immigrants | Iran | 98.9 /100 | #97 | Exceptional 93.5% |
| Immigrants | Israel | 98.8 /100 | #98 | Exceptional 93.5% |
| Menominee | 98.7 /100 | #99 | Exceptional 93.5% |
| Immigrants | North Macedonia | 98.7 /100 | #100 | Exceptional 93.5% |
| Immigrants | Romania | 98.7 /100 | #101 | Exceptional 93.5% |
| Chippewa | 98.6 /100 | #102 | Exceptional 93.5% |
| Lebanese | 98.6 /100 | #103 | Exceptional 93.5% |
| Immigrants | Europe | 98.6 /100 | #104 | Exceptional 93.5% |
| Immigrants | Serbia | 98.6 /100 | #105 | Exceptional 93.5% |
| Immigrants | Croatia | 98.6 /100 | #106 | Exceptional 93.5% |
| Immigrants | Norway | 98.4 /100 | #107 | Exceptional 93.5% |
| Alaska Natives | 98.4 /100 | #108 | Exceptional 93.5% |
| Immigrants | Kuwait | 98.4 /100 | #109 | Exceptional 93.5% |