Basque vs Yup'ik College, Under 1 year
COMPARE
Basque
Yup'ik
College, Under 1 year
College, Under 1 year Comparison
Basques
Yup'ik
67.6%
COLLEGE, UNDER 1 YEAR
95.2/ 100
METRIC RATING
115th/ 347
METRIC RANK
45.8%
COLLEGE, UNDER 1 YEAR
0.0/ 100
METRIC RATING
347th/ 347
METRIC RANK
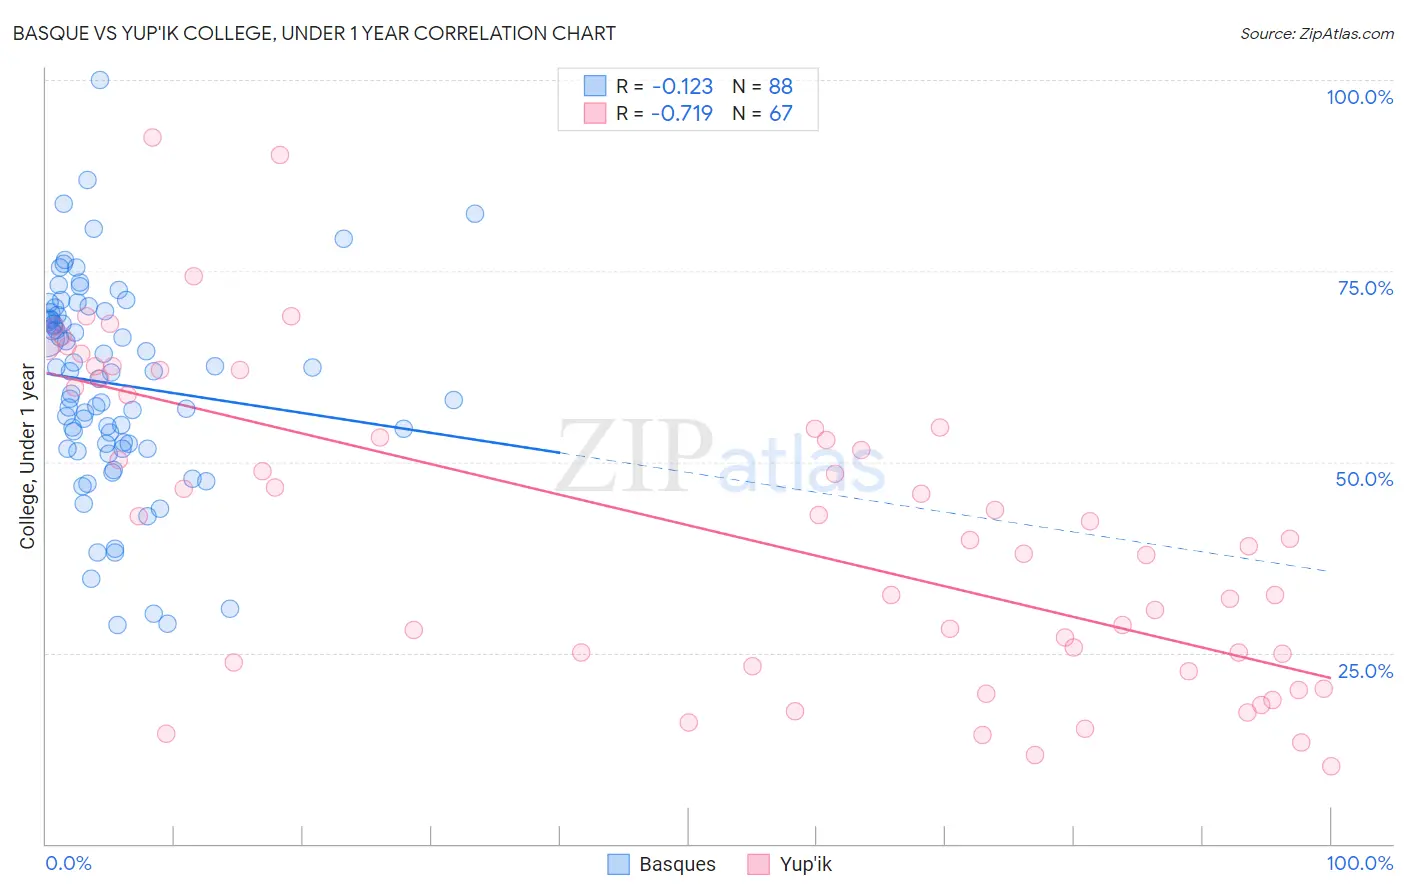
Basque vs Yup'ik College, Under 1 year Correlation Chart
The statistical analysis conducted on geographies consisting of 165,778,801 people shows a poor negative correlation between the proportion of Basques and percentage of population with at least college, under 1 year education in the United States with a correlation coefficient (R) of -0.123 and weighted average of 67.6%. Similarly, the statistical analysis conducted on geographies consisting of 39,964,395 people shows a strong negative correlation between the proportion of Yup'ik and percentage of population with at least college, under 1 year education in the United States with a correlation coefficient (R) of -0.719 and weighted average of 45.8%, a difference of 47.7%.
College, Under 1 year Correlation Summary
| Measurement | Basque | Yup'ik |
| Minimum | 28.6% | 10.2% |
| Maximum | 100.0% | 92.4% |
| Range | 71.4% | 82.2% |
| Mean | 60.2% | 41.4% |
| Median | 61.8% | 40.0% |
| Interquartile 25% (IQ1) | 52.1% | 23.8% |
| Interquartile 75% (IQ3) | 69.4% | 59.8% |
| Interquartile Range (IQR) | 17.3% | 36.0% |
| Standard Deviation (Sample) | 13.5% | 20.3% |
| Standard Deviation (Population) | 13.4% | 20.2% |
Similar Demographics by College, Under 1 year
Demographics Similar to Basques by College, Under 1 year
In terms of college, under 1 year, the demographic groups most similar to Basques are Chilean (67.6%, a difference of 0.010%), Immigrants from Nepal (67.5%, a difference of 0.080%), Syrian (67.6%, a difference of 0.090%), Pakistani (67.5%, a difference of 0.10%), and Macedonian (67.6%, a difference of 0.11%).
| Demographics | Rating | Rank | College, Under 1 year |
| Immigrants | Egypt | 96.0 /100 | #108 | Exceptional 67.7% |
| Scandinavians | 95.8 /100 | #109 | Exceptional 67.7% |
| Assyrians/Chaldeans/Syriacs | 95.8 /100 | #110 | Exceptional 67.7% |
| Ukrainians | 95.8 /100 | #111 | Exceptional 67.7% |
| Macedonians | 95.7 /100 | #112 | Exceptional 67.6% |
| Syrians | 95.6 /100 | #113 | Exceptional 67.6% |
| Chileans | 95.3 /100 | #114 | Exceptional 67.6% |
| Basques | 95.2 /100 | #115 | Exceptional 67.6% |
| Immigrants | Nepal | 94.9 /100 | #116 | Exceptional 67.5% |
| Pakistanis | 94.8 /100 | #117 | Exceptional 67.5% |
| Immigrants | Ukraine | 94.7 /100 | #118 | Exceptional 67.5% |
| Lebanese | 94.6 /100 | #119 | Exceptional 67.5% |
| Serbians | 93.9 /100 | #120 | Exceptional 67.4% |
| Slovenes | 93.3 /100 | #121 | Exceptional 67.3% |
| Immigrants | Jordan | 92.8 /100 | #122 | Exceptional 67.3% |
Demographics Similar to Yup'ik by College, Under 1 year
In terms of college, under 1 year, the demographic groups most similar to Yup'ik are Houma (47.6%, a difference of 4.1%), Pima (51.4%, a difference of 12.4%), Yakama (52.6%, a difference of 15.0%), Tohono O'odham (52.8%, a difference of 15.3%), and Immigrants from Mexico (53.7%, a difference of 17.2%).
| Demographics | Rating | Rank | College, Under 1 year |
| Yuman | 0.0 /100 | #333 | Tragic 55.1% |
| Immigrants | Azores | 0.0 /100 | #334 | Tragic 54.7% |
| Inupiat | 0.0 /100 | #335 | Tragic 54.6% |
| Pennsylvania Germans | 0.0 /100 | #336 | Tragic 54.5% |
| Immigrants | Central America | 0.0 /100 | #337 | Tragic 54.4% |
| Lumbee | 0.0 /100 | #338 | Tragic 54.2% |
| Immigrants | Dominican Republic | 0.0 /100 | #339 | Tragic 54.0% |
| Spanish American Indians | 0.0 /100 | #340 | Tragic 54.0% |
| Immigrants | Cabo Verde | 0.0 /100 | #341 | Tragic 53.7% |
| Immigrants | Mexico | 0.0 /100 | #342 | Tragic 53.7% |
| Tohono O'odham | 0.0 /100 | #343 | Tragic 52.8% |
| Yakama | 0.0 /100 | #344 | Tragic 52.6% |
| Pima | 0.0 /100 | #345 | Tragic 51.4% |
| Houma | 0.0 /100 | #346 | Tragic 47.6% |
| Yup'ik | 0.0 /100 | #347 | Tragic 45.8% |