Aleut vs Yup'ik College, Under 1 year
COMPARE
Aleut
Yup'ik
College, Under 1 year
College, Under 1 year Comparison
Aleuts
Yup'ik
62.2%
COLLEGE, UNDER 1 YEAR
1.1/ 100
METRIC RATING
240th/ 347
METRIC RANK
45.8%
COLLEGE, UNDER 1 YEAR
0.0/ 100
METRIC RATING
347th/ 347
METRIC RANK
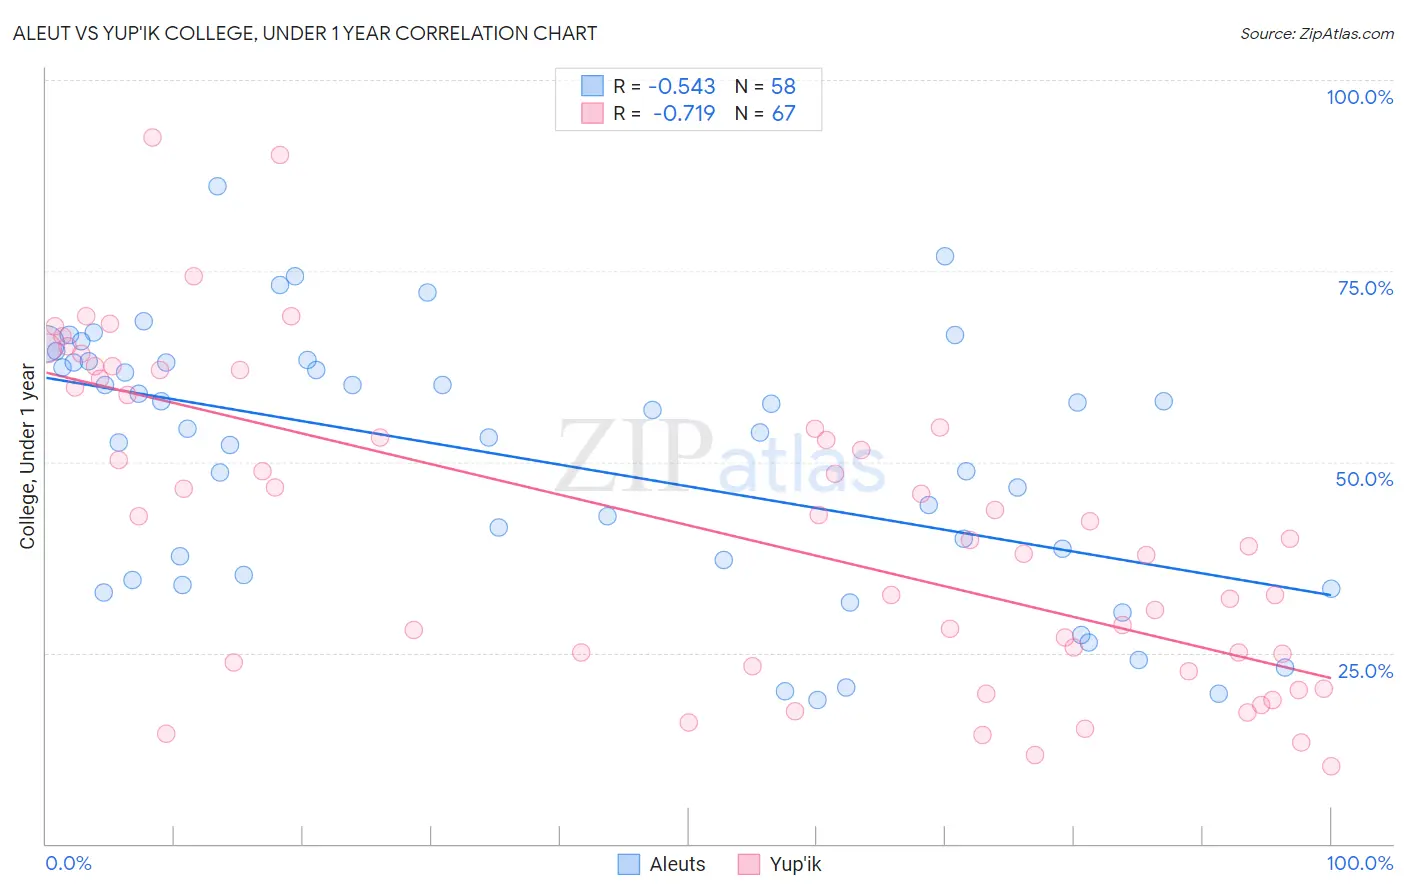
Aleut vs Yup'ik College, Under 1 year Correlation Chart
The statistical analysis conducted on geographies consisting of 61,782,940 people shows a substantial negative correlation between the proportion of Aleuts and percentage of population with at least college, under 1 year education in the United States with a correlation coefficient (R) of -0.543 and weighted average of 62.2%. Similarly, the statistical analysis conducted on geographies consisting of 39,964,395 people shows a strong negative correlation between the proportion of Yup'ik and percentage of population with at least college, under 1 year education in the United States with a correlation coefficient (R) of -0.719 and weighted average of 45.8%, a difference of 35.9%.
College, Under 1 year Correlation Summary
| Measurement | Aleut | Yup'ik |
| Minimum | 18.8% | 10.2% |
| Maximum | 86.1% | 92.4% |
| Range | 67.4% | 82.2% |
| Mean | 50.3% | 41.4% |
| Median | 54.1% | 40.0% |
| Interquartile 25% (IQ1) | 35.3% | 23.8% |
| Interquartile 75% (IQ3) | 63.1% | 59.8% |
| Interquartile Range (IQR) | 27.8% | 36.0% |
| Standard Deviation (Sample) | 16.9% | 20.3% |
| Standard Deviation (Population) | 16.7% | 20.2% |
Similar Demographics by College, Under 1 year
Demographics Similar to Aleuts by College, Under 1 year
In terms of college, under 1 year, the demographic groups most similar to Aleuts are Nepalese (62.2%, a difference of 0.0%), Ottawa (62.2%, a difference of 0.010%), Malaysian (62.2%, a difference of 0.060%), Hawaiian (62.1%, a difference of 0.090%), and Colville (62.1%, a difference of 0.18%).
| Demographics | Rating | Rank | College, Under 1 year |
| Iroquois | 2.0 /100 | #233 | Tragic 62.6% |
| Chippewa | 2.0 /100 | #234 | Tragic 62.6% |
| Spanish Americans | 1.9 /100 | #235 | Tragic 62.6% |
| Immigrants | Immigrants | 1.7 /100 | #236 | Tragic 62.5% |
| Immigrants | Burma/Myanmar | 1.6 /100 | #237 | Tragic 62.5% |
| French American Indians | 1.5 /100 | #238 | Tragic 62.4% |
| Nepalese | 1.1 /100 | #239 | Tragic 62.2% |
| Aleuts | 1.1 /100 | #240 | Tragic 62.2% |
| Ottawa | 1.1 /100 | #241 | Tragic 62.2% |
| Malaysians | 1.1 /100 | #242 | Tragic 62.2% |
| Hawaiians | 1.1 /100 | #243 | Tragic 62.1% |
| Colville | 1.0 /100 | #244 | Tragic 62.1% |
| Delaware | 0.9 /100 | #245 | Tragic 62.1% |
| Marshallese | 0.8 /100 | #246 | Tragic 61.9% |
| Immigrants | Liberia | 0.8 /100 | #247 | Tragic 61.9% |
Demographics Similar to Yup'ik by College, Under 1 year
In terms of college, under 1 year, the demographic groups most similar to Yup'ik are Houma (47.6%, a difference of 4.1%), Pima (51.4%, a difference of 12.4%), Yakama (52.6%, a difference of 15.0%), Tohono O'odham (52.8%, a difference of 15.3%), and Immigrants from Mexico (53.7%, a difference of 17.2%).
| Demographics | Rating | Rank | College, Under 1 year |
| Yuman | 0.0 /100 | #333 | Tragic 55.1% |
| Immigrants | Azores | 0.0 /100 | #334 | Tragic 54.7% |
| Inupiat | 0.0 /100 | #335 | Tragic 54.6% |
| Pennsylvania Germans | 0.0 /100 | #336 | Tragic 54.5% |
| Immigrants | Central America | 0.0 /100 | #337 | Tragic 54.4% |
| Lumbee | 0.0 /100 | #338 | Tragic 54.2% |
| Immigrants | Dominican Republic | 0.0 /100 | #339 | Tragic 54.0% |
| Spanish American Indians | 0.0 /100 | #340 | Tragic 54.0% |
| Immigrants | Cabo Verde | 0.0 /100 | #341 | Tragic 53.7% |
| Immigrants | Mexico | 0.0 /100 | #342 | Tragic 53.7% |
| Tohono O'odham | 0.0 /100 | #343 | Tragic 52.8% |
| Yakama | 0.0 /100 | #344 | Tragic 52.6% |
| Pima | 0.0 /100 | #345 | Tragic 51.4% |
| Houma | 0.0 /100 | #346 | Tragic 47.6% |
| Yup'ik | 0.0 /100 | #347 | Tragic 45.8% |