Yugoslavian vs Yup'ik College, Under 1 year
COMPARE
Yugoslavian
Yup'ik
College, Under 1 year
College, Under 1 year Comparison
Yugoslavians
Yup'ik
65.6%
COLLEGE, UNDER 1 YEAR
55.7/ 100
METRIC RATING
169th/ 347
METRIC RANK
45.8%
COLLEGE, UNDER 1 YEAR
0.0/ 100
METRIC RATING
347th/ 347
METRIC RANK
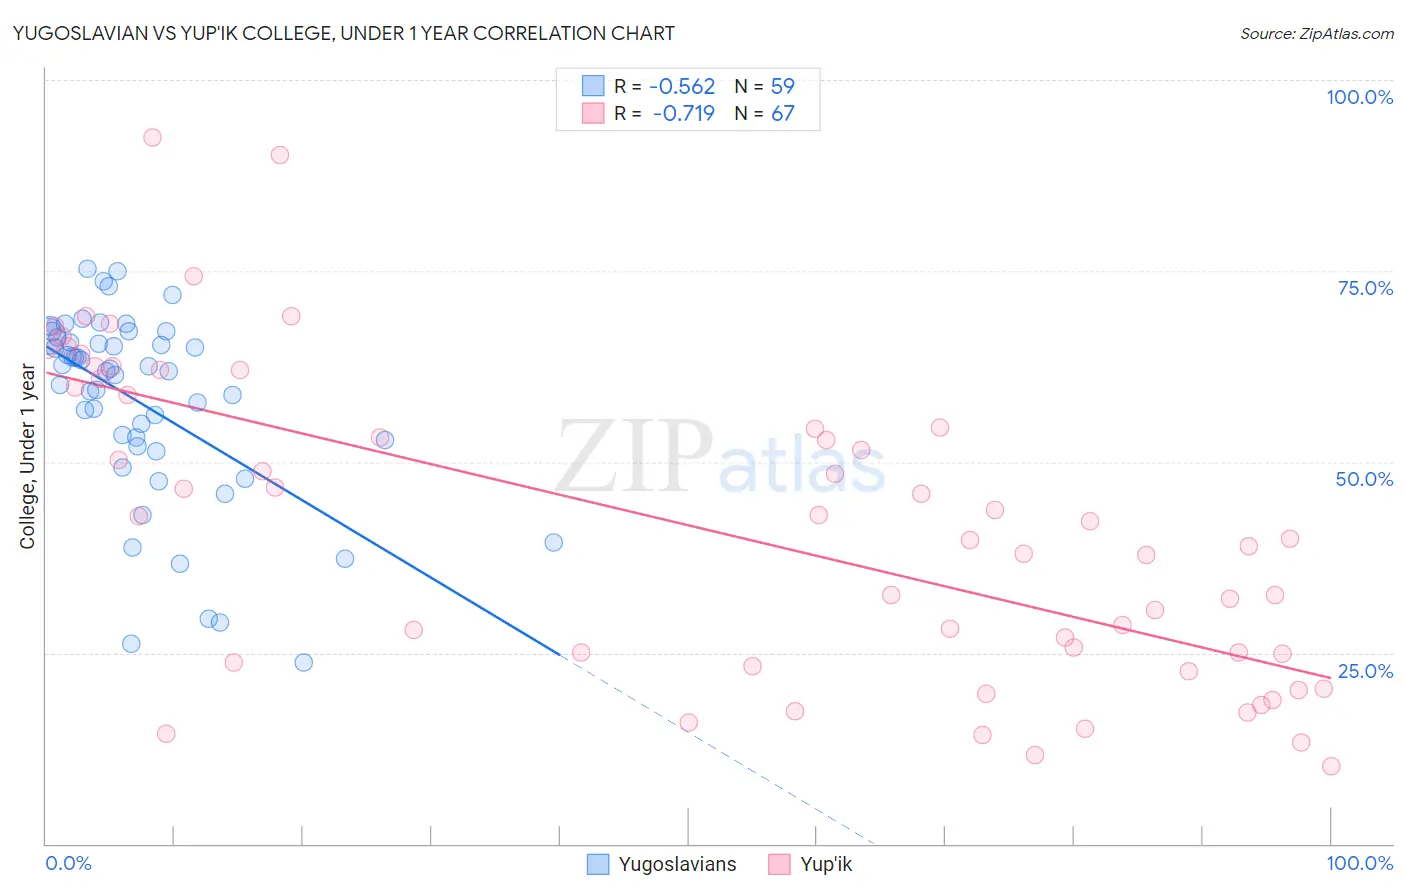
Yugoslavian vs Yup'ik College, Under 1 year Correlation Chart
The statistical analysis conducted on geographies consisting of 285,723,201 people shows a substantial negative correlation between the proportion of Yugoslavians and percentage of population with at least college, under 1 year education in the United States with a correlation coefficient (R) of -0.562 and weighted average of 65.6%. Similarly, the statistical analysis conducted on geographies consisting of 39,964,395 people shows a strong negative correlation between the proportion of Yup'ik and percentage of population with at least college, under 1 year education in the United States with a correlation coefficient (R) of -0.719 and weighted average of 45.8%, a difference of 43.3%.
College, Under 1 year Correlation Summary
| Measurement | Yugoslavian | Yup'ik |
| Minimum | 23.8% | 10.2% |
| Maximum | 75.2% | 92.4% |
| Range | 51.5% | 82.2% |
| Mean | 57.7% | 41.4% |
| Median | 61.9% | 40.0% |
| Interquartile 25% (IQ1) | 52.1% | 23.8% |
| Interquartile 75% (IQ3) | 66.3% | 59.8% |
| Interquartile Range (IQR) | 14.2% | 36.0% |
| Standard Deviation (Sample) | 12.5% | 20.3% |
| Standard Deviation (Population) | 12.3% | 20.2% |
Similar Demographics by College, Under 1 year
Demographics Similar to Yugoslavians by College, Under 1 year
In terms of college, under 1 year, the demographic groups most similar to Yugoslavians are German (65.6%, a difference of 0.0%), Hungarian (65.6%, a difference of 0.010%), Immigrants from Somalia (65.6%, a difference of 0.030%), Immigrants from Oceania (65.6%, a difference of 0.030%), and Moroccan (65.6%, a difference of 0.040%).
| Demographics | Rating | Rank | College, Under 1 year |
| Koreans | 65.3 /100 | #162 | Good 65.9% |
| Somalis | 62.7 /100 | #163 | Good 65.8% |
| Czechoslovakians | 62.6 /100 | #164 | Good 65.8% |
| Immigrants | Uzbekistan | 61.6 /100 | #165 | Good 65.8% |
| Moroccans | 56.7 /100 | #166 | Average 65.6% |
| Immigrants | Somalia | 56.4 /100 | #167 | Average 65.6% |
| Hungarians | 55.9 /100 | #168 | Average 65.6% |
| Yugoslavians | 55.7 /100 | #169 | Average 65.6% |
| Germans | 55.7 /100 | #170 | Average 65.6% |
| Immigrants | Oceania | 55.0 /100 | #171 | Average 65.6% |
| South American Indians | 54.4 /100 | #172 | Average 65.5% |
| Swiss | 53.9 /100 | #173 | Average 65.5% |
| Immigrants | Bosnia and Herzegovina | 50.0 /100 | #174 | Average 65.4% |
| Scotch-Irish | 49.5 /100 | #175 | Average 65.4% |
| French | 48.9 /100 | #176 | Average 65.4% |
Demographics Similar to Yup'ik by College, Under 1 year
In terms of college, under 1 year, the demographic groups most similar to Yup'ik are Houma (47.6%, a difference of 4.1%), Pima (51.4%, a difference of 12.4%), Yakama (52.6%, a difference of 15.0%), Tohono O'odham (52.8%, a difference of 15.3%), and Immigrants from Mexico (53.7%, a difference of 17.2%).
| Demographics | Rating | Rank | College, Under 1 year |
| Yuman | 0.0 /100 | #333 | Tragic 55.1% |
| Immigrants | Azores | 0.0 /100 | #334 | Tragic 54.7% |
| Inupiat | 0.0 /100 | #335 | Tragic 54.6% |
| Pennsylvania Germans | 0.0 /100 | #336 | Tragic 54.5% |
| Immigrants | Central America | 0.0 /100 | #337 | Tragic 54.4% |
| Lumbee | 0.0 /100 | #338 | Tragic 54.2% |
| Immigrants | Dominican Republic | 0.0 /100 | #339 | Tragic 54.0% |
| Spanish American Indians | 0.0 /100 | #340 | Tragic 54.0% |
| Immigrants | Cabo Verde | 0.0 /100 | #341 | Tragic 53.7% |
| Immigrants | Mexico | 0.0 /100 | #342 | Tragic 53.7% |
| Tohono O'odham | 0.0 /100 | #343 | Tragic 52.8% |
| Yakama | 0.0 /100 | #344 | Tragic 52.6% |
| Pima | 0.0 /100 | #345 | Tragic 51.4% |
| Houma | 0.0 /100 | #346 | Tragic 47.6% |
| Yup'ik | 0.0 /100 | #347 | Tragic 45.8% |